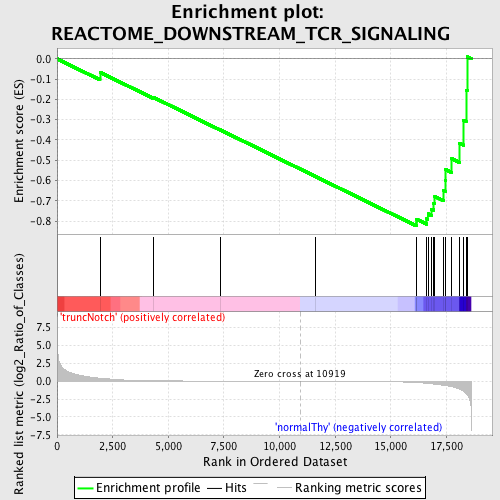
Profile of the Running ES Score & Positions of GeneSet Members on the Rank Ordered List
| Dataset | Set_03_truncNotch_versus_normalThy.phenotype_truncNotch_versus_normalThy.cls #truncNotch_versus_normalThy.phenotype_truncNotch_versus_normalThy.cls #truncNotch_versus_normalThy_repos |
| Phenotype | phenotype_truncNotch_versus_normalThy.cls#truncNotch_versus_normalThy_repos |
| Upregulated in class | normalThy |
| GeneSet | REACTOME_DOWNSTREAM_TCR_SIGNALING |
| Enrichment Score (ES) | -0.82422554 |
| Normalized Enrichment Score (NES) | -1.5159513 |
| Nominal p-value | 0.01843318 |
| FDR q-value | 0.36278075 |
| FWER p-Value | 0.983 |
| PROBE | DESCRIPTION (from dataset) | GENE SYMBOL | GENE_TITLE | RANK IN GENE LIST | RANK METRIC SCORE | RUNNING ES | CORE ENRICHMENT | |
|---|---|---|---|---|---|---|---|---|
| 1 | NFKB1 | 5420358 | 1928 | 0.422 | -0.0663 | No | ||
| 2 | UBE2N | 520369 2900047 | 4320 | 0.061 | -0.1894 | No | ||
| 3 | PIK3R1 | 4730671 | 7321 | 0.013 | -0.3496 | No | ||
| 4 | PRKCQ | 2260170 3870193 | 11610 | -0.002 | -0.5800 | No | ||
| 5 | RIPK2 | 5050072 6290632 | 16153 | -0.187 | -0.8076 | Yes | ||
| 6 | MAP3K7 | 6040068 | 16155 | -0.188 | -0.7910 | Yes | ||
| 7 | IKBKB | 6840072 | 16617 | -0.298 | -0.7894 | Yes | ||
| 8 | LCK | 3360142 | 16671 | -0.311 | -0.7647 | Yes | ||
| 9 | RELA | 3830075 | 16834 | -0.358 | -0.7416 | Yes | ||
| 10 | PIK3CB | 3800600 | 16926 | -0.388 | -0.7121 | Yes | ||
| 11 | CD3D | 2810739 | 16975 | -0.406 | -0.6787 | Yes | ||
| 12 | CHUK | 7050736 | 17374 | -0.567 | -0.6498 | Yes | ||
| 13 | NFKBIA | 1570152 | 17455 | -0.610 | -0.6000 | Yes | ||
| 14 | PTEN | 3390064 | 17467 | -0.618 | -0.5458 | Yes | ||
| 15 | BCL10 | 2360397 | 17734 | -0.764 | -0.4924 | Yes | ||
| 16 | CD3E | 3800056 | 18080 | -1.072 | -0.4159 | Yes | ||
| 17 | CD4 | 1090010 | 18267 | -1.396 | -0.3021 | Yes | ||
| 18 | PDPK1 | 6650168 | 18388 | -1.747 | -0.1537 | Yes | ||
| 19 | CD3G | 2680288 | 18433 | -1.872 | 0.0098 | Yes |

