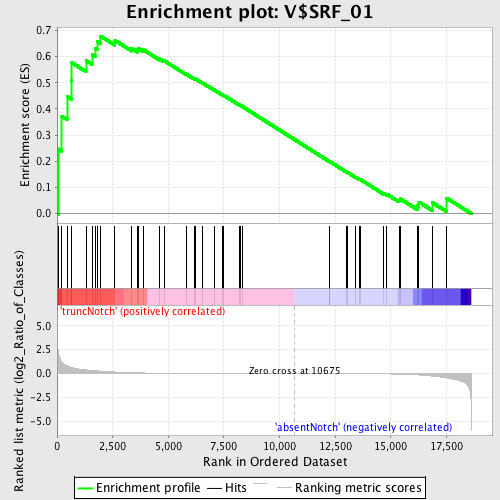
Profile of the Running ES Score & Positions of GeneSet Members on the Rank Ordered List
| Dataset | Set_03_absentNotch_versus_truncNotch.phenotype_absentNotch_versus_truncNotch.cls #truncNotch_versus_absentNotch |
| Phenotype | phenotype_absentNotch_versus_truncNotch.cls#truncNotch_versus_absentNotch |
| Upregulated in class | truncNotch |
| GeneSet | V$SRF_01 |
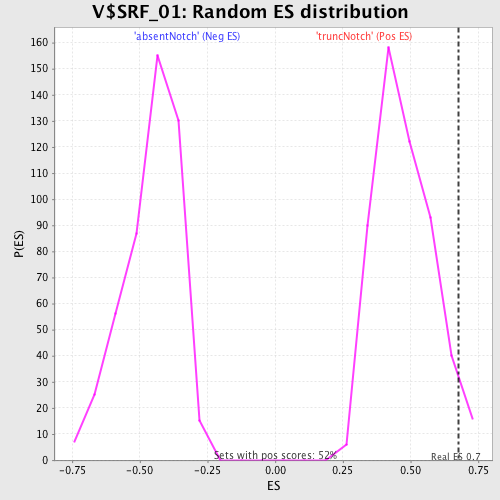
| Enrichment Score (ES) | 0.6782786 |
| Normalized Enrichment Score (NES) | 1.4252168 |
| Nominal p-value | 0.034285713 |
| FDR q-value | 0.6387006 |
| FWER p-Value | 0.998 |
| PROBE | DESCRIPTION (from dataset) | GENE SYMBOL | GENE_TITLE | RANK IN GENE LIST | RANK METRIC SCORE | RUNNING ES | CORE ENRICHMENT | |
|---|---|---|---|---|---|---|---|---|
| 1 | CNN2 | 2230433 5270446 | 60 | 2.206 | 0.2470 | Yes | ||
| 2 | EGR1 | 4610347 | 214 | 1.171 | 0.3715 | Yes | ||
| 3 | ANXA6 | 2190014 | 466 | 0.784 | 0.4469 | Yes | ||
| 4 | ASB2 | 4760168 | 640 | 0.627 | 0.5088 | Yes | ||
| 5 | MUS81 | 6660184 | 665 | 0.611 | 0.5768 | Yes | ||
| 6 | TPM1 | 130673 | 1299 | 0.374 | 0.5852 | Yes | ||
| 7 | MYL6 | 60563 6100152 | 1572 | 0.317 | 0.6065 | Yes | ||
| 8 | JUNB | 4230048 | 1713 | 0.291 | 0.6320 | Yes | ||
| 9 | FLNA | 5390193 | 1819 | 0.273 | 0.6573 | Yes | ||
| 10 | TAZ | 7100193 | 1956 | 0.250 | 0.6783 | Yes | ||
| 11 | CAP1 | 2650278 | 2600 | 0.162 | 0.6620 | No | ||
| 12 | EGR3 | 6940128 | 3356 | 0.086 | 0.6311 | No | ||
| 13 | ACTG2 | 4780180 | 3612 | 0.072 | 0.6255 | No | ||
| 14 | PLCB3 | 4670402 | 3661 | 0.069 | 0.6308 | No | ||
| 15 | MRVI1 | 4810338 4850601 5900441 | 3876 | 0.060 | 0.6261 | No | ||
| 16 | TNNC1 | 1990575 | 4604 | 0.039 | 0.5914 | No | ||
| 17 | FOS | 1850315 | 4806 | 0.035 | 0.5846 | No | ||
| 18 | CFL1 | 2340735 | 5801 | 0.021 | 0.5335 | No | ||
| 19 | IER2 | 2030008 | 6163 | 0.017 | 0.5160 | No | ||
| 20 | CA3 | 870687 5890390 | 6198 | 0.017 | 0.5161 | No | ||
| 21 | THBS1 | 4560494 430288 | 6523 | 0.015 | 0.5004 | No | ||
| 22 | CALD1 | 1770129 1940397 | 7055 | 0.011 | 0.4731 | No | ||
| 23 | PHOX2B | 5270075 | 7442 | 0.010 | 0.4534 | No | ||
| 24 | TGFB1I1 | 2060288 6550450 | 7465 | 0.009 | 0.4532 | No | ||
| 25 | KCNMB1 | 4760139 | 8177 | 0.007 | 0.4158 | No | ||
| 26 | DIXDC1 | 6980435 | 8253 | 0.007 | 0.4125 | No | ||
| 27 | FOSL1 | 430021 | 8317 | 0.006 | 0.4098 | No | ||
| 28 | FOSB | 1940142 | 12245 | -0.004 | 0.1989 | No | ||
| 29 | MYH11 | 7100273 | 12247 | -0.004 | 0.1994 | No | ||
| 30 | ACTR3 | 1400497 | 13008 | -0.008 | 0.1593 | No | ||
| 31 | IL17B | 6940711 | 13074 | -0.008 | 0.1567 | No | ||
| 32 | GPR20 | 6620601 | 13420 | -0.010 | 0.1393 | No | ||
| 33 | ITGB1BP2 | 6200129 | 13588 | -0.011 | 0.1316 | No | ||
| 34 | TNMD | 3060520 | 13624 | -0.012 | 0.1310 | No | ||
| 35 | PFN1 | 6130132 | 14687 | -0.031 | 0.0774 | No | ||
| 36 | EGR4 | 3120750 | 14822 | -0.036 | 0.0742 | No | ||
| 37 | SCOC | 610048 2230053 | 15370 | -0.064 | 0.0520 | No | ||
| 38 | EGR2 | 3800403 | 15434 | -0.068 | 0.0563 | No | ||
| 39 | WDR1 | 1090129 3990121 | 16191 | -0.138 | 0.0312 | No | ||
| 40 | SLC25A4 | 2360519 | 16265 | -0.148 | 0.0441 | No | ||
| 41 | HOXB4 | 540131 | 16867 | -0.269 | 0.0422 | No | ||
| 42 | VCL | 4120487 | 17507 | -0.457 | 0.0597 | No |