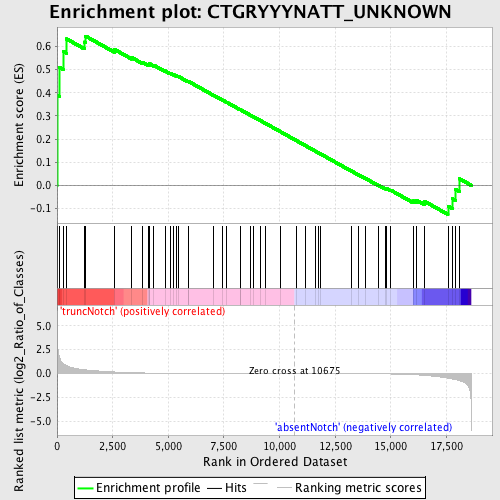
Profile of the Running ES Score & Positions of GeneSet Members on the Rank Ordered List
| Dataset | Set_03_absentNotch_versus_truncNotch.phenotype_absentNotch_versus_truncNotch.cls #truncNotch_versus_absentNotch |
| Phenotype | phenotype_absentNotch_versus_truncNotch.cls#truncNotch_versus_absentNotch |
| Upregulated in class | truncNotch |
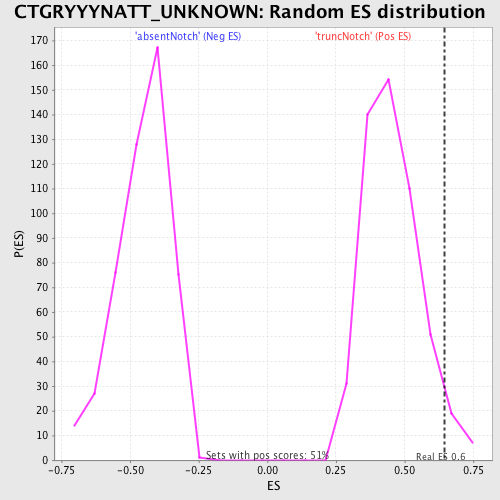
| GeneSet | CTGRYYYNATT_UNKNOWN |
| Enrichment Score (ES) | 0.64512074 |
| Normalized Enrichment Score (NES) | 1.4150422 |
| Nominal p-value | 0.044921875 |
| FDR q-value | 0.47701555 |
| FWER p-Value | 0.999 |
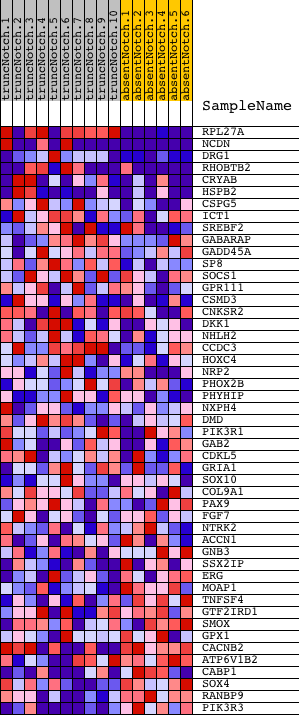
| PROBE | DESCRIPTION (from dataset) | GENE SYMBOL | GENE_TITLE | RANK IN GENE LIST | RANK METRIC SCORE | RUNNING ES | CORE ENRICHMENT | |
|---|---|---|---|---|---|---|---|---|
| 1 | RPL27A | 3130451 110195 6840494 | 2 | 5.164 | 0.3886 | Yes | ||
| 2 | NCDN | 50040 1980739 3520603 | 104 | 1.679 | 0.5095 | Yes | ||
| 3 | DRG1 | 1660372 5050435 | 273 | 1.042 | 0.5789 | Yes | ||
| 4 | RHOBTB2 | 1570129 2320253 3520253 | 426 | 0.828 | 0.6330 | Yes | ||
| 5 | CRYAB | 4810619 | 1223 | 0.393 | 0.6197 | Yes | ||
| 6 | HSPB2 | 1990110 | 1281 | 0.378 | 0.6451 | Yes | ||
| 7 | CSPG5 | 6370291 | 2578 | 0.164 | 0.5876 | No | ||
| 8 | ICT1 | 430138 | 3355 | 0.086 | 0.5524 | No | ||
| 9 | SREBF2 | 3390692 | 3818 | 0.063 | 0.5322 | No | ||
| 10 | GABARAP | 1450286 | 4120 | 0.052 | 0.5199 | No | ||
| 11 | GADD45A | 2900717 | 4152 | 0.051 | 0.5221 | No | ||
| 12 | SP8 | 4060576 | 4155 | 0.051 | 0.5259 | No | ||
| 13 | SOCS1 | 730139 | 4350 | 0.046 | 0.5189 | No | ||
| 14 | GPR111 | 2350008 | 4849 | 0.035 | 0.4947 | No | ||
| 15 | CSMD3 | 1660427 1940687 | 5077 | 0.031 | 0.4847 | No | ||
| 16 | CNKSR2 | 110348 1770372 | 5226 | 0.028 | 0.4789 | No | ||
| 17 | DKK1 | 1940215 | 5361 | 0.026 | 0.4736 | No | ||
| 18 | NHLH2 | 6200021 | 5458 | 0.025 | 0.4703 | No | ||
| 19 | CCDC3 | 7000441 | 5888 | 0.020 | 0.4487 | No | ||
| 20 | HOXC4 | 1940193 | 5896 | 0.020 | 0.4498 | No | ||
| 21 | NRP2 | 4070400 5860041 6650446 | 7033 | 0.012 | 0.3895 | No | ||
| 22 | PHOX2B | 5270075 | 7442 | 0.010 | 0.3682 | No | ||
| 23 | PHYHIP | 1170377 | 7609 | 0.009 | 0.3600 | No | ||
| 24 | NXPH4 | 3830500 | 8222 | 0.007 | 0.3275 | No | ||
| 25 | DMD | 1740041 3990332 | 8245 | 0.007 | 0.3268 | No | ||
| 26 | PIK3R1 | 4730671 | 8693 | 0.005 | 0.3032 | No | ||
| 27 | GAB2 | 1410280 2340520 4280040 | 8814 | 0.005 | 0.2971 | No | ||
| 28 | CDKL5 | 2450070 | 9147 | 0.004 | 0.2795 | No | ||
| 29 | GRIA1 | 1340152 3780750 4920440 | 9373 | 0.003 | 0.2676 | No | ||
| 30 | SOX10 | 6200538 | 10051 | 0.002 | 0.2313 | No | ||
| 31 | COL9A1 | 4570369 7100446 | 10775 | -0.000 | 0.1923 | No | ||
| 32 | PAX9 | 3850519 | 11157 | -0.001 | 0.1719 | No | ||
| 33 | FGF7 | 5390484 | 11634 | -0.003 | 0.1465 | No | ||
| 34 | NTRK2 | 6220463 | 11740 | -0.003 | 0.1410 | No | ||
| 35 | ACCN1 | 2060139 2190541 | 11824 | -0.003 | 0.1368 | No | ||
| 36 | GNB3 | 1230167 | 13218 | -0.009 | 0.0624 | No | ||
| 37 | SSX2IP | 4610176 | 13554 | -0.011 | 0.0452 | No | ||
| 38 | ERG | 50154 1770739 | 13880 | -0.014 | 0.0288 | No | ||
| 39 | MOAP1 | 580537 | 14458 | -0.024 | -0.0005 | No | ||
| 40 | TNFSF4 | 3940594 | 14747 | -0.033 | -0.0135 | No | ||
| 41 | GTF2IRD1 | 2030154 3990040 5080372 | 14797 | -0.035 | -0.0135 | No | ||
| 42 | SMOX | 50019 1940398 3390164 5050672 | 14993 | -0.043 | -0.0208 | No | ||
| 43 | GPX1 | 4150093 | 16023 | -0.119 | -0.0672 | No | ||
| 44 | CACNB2 | 1500095 7330707 | 16154 | -0.132 | -0.0642 | No | ||
| 45 | ATP6V1B2 | 4060528 | 16526 | -0.193 | -0.0697 | No | ||
| 46 | CABP1 | 6350750 | 17571 | -0.486 | -0.0894 | No | ||
| 47 | SOX4 | 2260091 | 17766 | -0.562 | -0.0575 | No | ||
| 48 | RANBP9 | 4670685 | 17903 | -0.626 | -0.0177 | No | ||
| 49 | PIK3R3 | 1770333 | 18093 | -0.744 | 0.0282 | No |