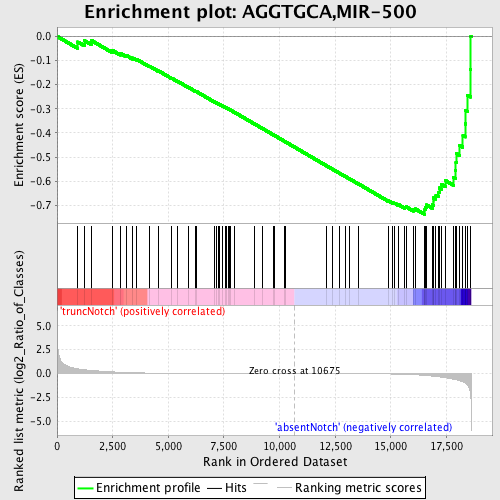
Profile of the Running ES Score & Positions of GeneSet Members on the Rank Ordered List
| Dataset | Set_03_absentNotch_versus_truncNotch.phenotype_absentNotch_versus_truncNotch.cls #truncNotch_versus_absentNotch |
| Phenotype | phenotype_absentNotch_versus_truncNotch.cls#truncNotch_versus_absentNotch |
| Upregulated in class | absentNotch |
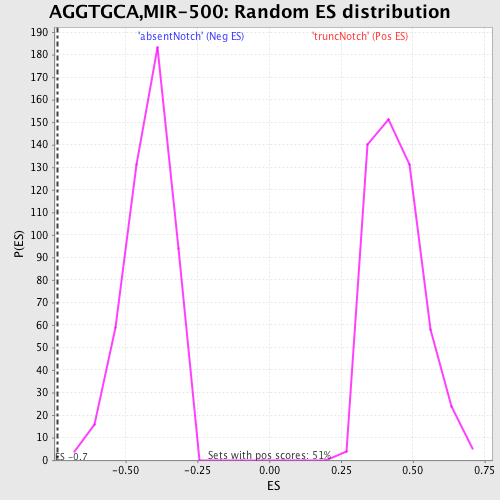
| GeneSet | AGGTGCA,MIR-500 |
| Enrichment Score (ES) | -0.7379583 |
| Normalized Enrichment Score (NES) | -1.7576946 |
| Nominal p-value | 0.0 |
| FDR q-value | 0.0025465623 |
| FWER p-Value | 0.0090 |
| PROBE | DESCRIPTION (from dataset) | GENE SYMBOL | GENE_TITLE | RANK IN GENE LIST | RANK METRIC SCORE | RUNNING ES | CORE ENRICHMENT | |
|---|---|---|---|---|---|---|---|---|
| 1 | RTN4RL1 | 2630368 | 928 | 0.486 | -0.0233 | No | ||
| 2 | EGLN2 | 540086 | 1231 | 0.391 | -0.0180 | No | ||
| 3 | RNF40 | 3610397 | 1540 | 0.322 | -0.0169 | No | ||
| 4 | PPP3CC | 2450139 | 2496 | 0.173 | -0.0588 | No | ||
| 5 | POFUT1 | 1570458 | 2843 | 0.129 | -0.0703 | No | ||
| 6 | FBXW7 | 4210338 7050280 | 3099 | 0.104 | -0.0783 | No | ||
| 7 | HNRPA0 | 2680048 | 3393 | 0.084 | -0.0895 | No | ||
| 8 | MYNN | 1980022 4210358 | 3555 | 0.075 | -0.0941 | No | ||
| 9 | SP8 | 4060576 | 4155 | 0.051 | -0.1235 | No | ||
| 10 | RNF38 | 1940746 3140133 3840601 | 4560 | 0.040 | -0.1431 | No | ||
| 11 | LBP | 6860019 | 5141 | 0.029 | -0.1727 | No | ||
| 12 | MATR3 | 1940170 5340278 | 5414 | 0.025 | -0.1860 | No | ||
| 13 | CELSR3 | 5270731 7100082 | 5914 | 0.020 | -0.2118 | No | ||
| 14 | TSSK2 | 5220324 | 6202 | 0.017 | -0.2264 | No | ||
| 15 | RAI2 | 6770333 | 6252 | 0.017 | -0.2281 | No | ||
| 16 | PLXDC2 | 6400358 | 7084 | 0.011 | -0.2723 | No | ||
| 17 | CACNB1 | 2940427 3710487 | 7166 | 0.011 | -0.2760 | No | ||
| 18 | GPM6A | 1660044 2750152 | 7246 | 0.011 | -0.2797 | No | ||
| 19 | SYT8 | 4280551 | 7282 | 0.010 | -0.2810 | No | ||
| 20 | PHOX2B | 5270075 | 7442 | 0.010 | -0.2891 | No | ||
| 21 | OSBPL10 | 1980184 | 7576 | 0.009 | -0.2957 | No | ||
| 22 | LRRTM3 | 4210021 | 7601 | 0.009 | -0.2965 | No | ||
| 23 | SLC25A26 | 4210577 | 7682 | 0.009 | -0.3004 | No | ||
| 24 | TBX2 | 1990563 | 7748 | 0.008 | -0.3034 | No | ||
| 25 | CHRD | 3140368 | 7810 | 0.008 | -0.3063 | No | ||
| 26 | CIT | 2370601 | 7978 | 0.008 | -0.3148 | No | ||
| 27 | HLF | 2370113 | 8885 | 0.005 | -0.3634 | No | ||
| 28 | HSPA14 | 4610487 | 9223 | 0.004 | -0.3814 | No | ||
| 29 | GABRB3 | 4150164 | 9729 | 0.002 | -0.4085 | No | ||
| 30 | SHPRH | 3990458 | 9791 | 0.002 | -0.4117 | No | ||
| 31 | SPG3A | 2760091 3120170 | 10230 | 0.001 | -0.4352 | No | ||
| 32 | BTBD11 | 6650154 | 10249 | 0.001 | -0.4361 | No | ||
| 33 | PRKCE | 5700053 | 12122 | -0.004 | -0.5368 | No | ||
| 34 | DDX3Y | 1580278 4200519 | 12364 | -0.005 | -0.5496 | No | ||
| 35 | FIGN | 7000601 | 12712 | -0.006 | -0.5679 | No | ||
| 36 | ESRRG | 4010181 | 12954 | -0.007 | -0.5805 | No | ||
| 37 | RAB21 | 5570070 | 13128 | -0.008 | -0.5894 | No | ||
| 38 | DRD1 | 430025 | 13526 | -0.011 | -0.6102 | No | ||
| 39 | THAP11 | 6940025 | 14883 | -0.038 | -0.6812 | No | ||
| 40 | CREB1 | 1500717 2230358 3610600 6550601 | 15093 | -0.048 | -0.6898 | No | ||
| 41 | E2F3 | 50162 460180 | 15177 | -0.052 | -0.6914 | No | ||
| 42 | NOLA2 | 4060167 | 15324 | -0.061 | -0.6959 | No | ||
| 43 | NFAT5 | 2510411 5890195 6550152 | 15629 | -0.081 | -0.7078 | No | ||
| 44 | SORCS1 | 60411 5890373 | 15682 | -0.086 | -0.7059 | No | ||
| 45 | HIPK1 | 110193 | 16015 | -0.118 | -0.7173 | No | ||
| 46 | KPNA3 | 7040088 | 16100 | -0.126 | -0.7149 | No | ||
| 47 | SEC24C | 6980707 | 16529 | -0.194 | -0.7273 | Yes | ||
| 48 | NRF1 | 2650195 | 16530 | -0.194 | -0.7166 | Yes | ||
| 49 | CAMK4 | 1690091 | 16555 | -0.198 | -0.7070 | Yes | ||
| 50 | ABCC4 | 130309 | 16609 | -0.208 | -0.6984 | Yes | ||
| 51 | SOCS2 | 4760692 | 16870 | -0.269 | -0.6976 | Yes | ||
| 52 | PURB | 5360138 | 16916 | -0.280 | -0.6846 | Yes | ||
| 53 | UBE2D3 | 3190452 | 16917 | -0.280 | -0.6692 | Yes | ||
| 54 | PPP4R1 | 5670088 6420402 | 17027 | -0.310 | -0.6580 | Yes | ||
| 55 | ING4 | 510632 2340619 2850176 5290706 | 17136 | -0.340 | -0.6451 | Yes | ||
| 56 | OGT | 2360131 4610333 | 17176 | -0.350 | -0.6279 | Yes | ||
| 57 | NCOA1 | 3610438 | 17281 | -0.377 | -0.6128 | Yes | ||
| 58 | SLC4A7 | 2370056 | 17468 | -0.445 | -0.5983 | Yes | ||
| 59 | PPP2R5E | 70671 2120056 | 17815 | -0.583 | -0.5848 | Yes | ||
| 60 | RBMS1 | 6400014 | 17915 | -0.633 | -0.5553 | Yes | ||
| 61 | DCTN4 | 3390010 5550170 | 17926 | -0.639 | -0.5206 | Yes | ||
| 62 | KBTBD2 | 2320014 | 17959 | -0.655 | -0.4863 | Yes | ||
| 63 | DDX3X | 2190020 | 18098 | -0.751 | -0.4523 | Yes | ||
| 64 | TIMM8A | 110279 | 18242 | -0.875 | -0.4118 | Yes | ||
| 65 | APRIN | 2810050 | 18339 | -0.987 | -0.3626 | Yes | ||
| 66 | RAB14 | 6860139 | 18356 | -1.015 | -0.3075 | Yes | ||
| 67 | IVNS1ABP | 4760601 6520113 | 18451 | -1.233 | -0.2447 | Yes | ||
| 68 | KLF9 | 3840022 | 18577 | -2.081 | -0.1368 | Yes | ||
| 69 | CUTL1 | 1570113 1770091 1850273 2100286 5340605 | 18597 | -2.519 | 0.0010 | Yes |