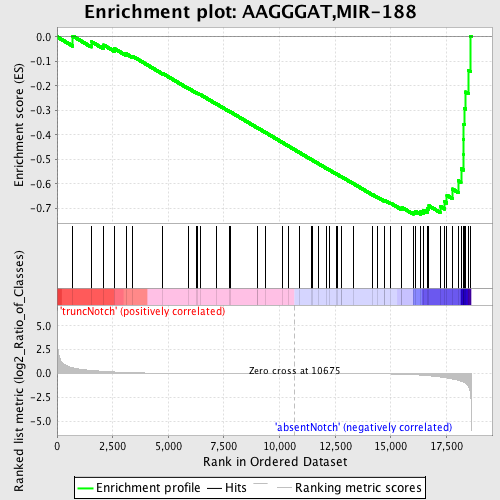
Profile of the Running ES Score & Positions of GeneSet Members on the Rank Ordered List
| Dataset | Set_03_absentNotch_versus_truncNotch.phenotype_absentNotch_versus_truncNotch.cls #truncNotch_versus_absentNotch |
| Phenotype | phenotype_absentNotch_versus_truncNotch.cls#truncNotch_versus_absentNotch |
| Upregulated in class | absentNotch |
| GeneSet | AAGGGAT,MIR-188 |
| Enrichment Score (ES) | -0.7248848 |
| Normalized Enrichment Score (NES) | -1.6470586 |
| Nominal p-value | 0.0021645022 |
| FDR q-value | 0.014727664 |
| FWER p-Value | 0.163 |
| PROBE | DESCRIPTION (from dataset) | GENE SYMBOL | GENE_TITLE | RANK IN GENE LIST | RANK METRIC SCORE | RUNNING ES | CORE ENRICHMENT | |
|---|---|---|---|---|---|---|---|---|
| 1 | CDC25B | 6940102 | 707 | 0.592 | 0.0028 | No | ||
| 2 | DEDD | 6400131 | 1532 | 0.323 | -0.0193 | No | ||
| 3 | MAP3K3 | 610685 | 2091 | 0.231 | -0.0334 | No | ||
| 4 | BCL9 | 7100112 | 2591 | 0.163 | -0.0490 | No | ||
| 5 | FBXW7 | 4210338 7050280 | 3099 | 0.104 | -0.0691 | No | ||
| 6 | DLG5 | 450215 | 3381 | 0.084 | -0.0784 | No | ||
| 7 | PDE4A | 1190619 1340129 5720100 6370035 | 4754 | 0.036 | -0.1499 | No | ||
| 8 | PHACTR2 | 1580154 | 5913 | 0.020 | -0.2109 | No | ||
| 9 | EPHA4 | 460750 | 6242 | 0.017 | -0.2274 | No | ||
| 10 | ATXN1 | 5550156 | 6310 | 0.016 | -0.2299 | No | ||
| 11 | MAPK8IP2 | 630373 | 6447 | 0.015 | -0.2362 | No | ||
| 12 | CXXC5 | 840010 | 7178 | 0.011 | -0.2747 | No | ||
| 13 | CNIH | 2190484 5080609 | 7738 | 0.008 | -0.3043 | No | ||
| 14 | CHRD | 3140368 | 7810 | 0.008 | -0.3075 | No | ||
| 15 | MAFB | 1230471 | 9005 | 0.004 | -0.3716 | No | ||
| 16 | CGN | 5890139 6370167 6400537 | 9008 | 0.004 | -0.3714 | No | ||
| 17 | CPNE8 | 7040039 | 9378 | 0.003 | -0.3910 | No | ||
| 18 | HNT | 6450731 | 10148 | 0.001 | -0.4324 | No | ||
| 19 | KITLG | 2120047 6220300 | 10396 | 0.001 | -0.4456 | No | ||
| 20 | AP1S3 | 510594 1450242 2190576 | 10901 | -0.001 | -0.4728 | No | ||
| 21 | KLF12 | 1660095 4810288 5340546 6520286 | 11455 | -0.002 | -0.5024 | No | ||
| 22 | USP28 | 1450010 | 11481 | -0.002 | -0.5036 | No | ||
| 23 | EFNB2 | 5340136 | 11744 | -0.003 | -0.5175 | No | ||
| 24 | SLITRK4 | 5910022 | 12100 | -0.004 | -0.5364 | No | ||
| 25 | CCNT2 | 2100390 4150563 | 12259 | -0.005 | -0.5446 | No | ||
| 26 | EDG2 | 6290215 | 12545 | -0.006 | -0.5595 | No | ||
| 27 | UBE2I | 2680056 6350446 | 12621 | -0.006 | -0.5632 | No | ||
| 28 | MEF2C | 670025 780338 | 12780 | -0.007 | -0.5712 | No | ||
| 29 | COVA1 | 5340504 5360594 | 12793 | -0.007 | -0.5714 | No | ||
| 30 | ESR1 | 4060372 5860193 | 13313 | -0.009 | -0.5987 | No | ||
| 31 | PCDH9 | 2100136 | 14192 | -0.019 | -0.6447 | No | ||
| 32 | RSPO3 | 7550703 6840435 | 14408 | -0.023 | -0.6547 | No | ||
| 33 | LUZP1 | 940075 4280458 6180070 | 14704 | -0.032 | -0.6684 | No | ||
| 34 | IL13RA1 | 5550609 | 14718 | -0.032 | -0.6669 | No | ||
| 35 | SPRED1 | 6940706 | 14983 | -0.043 | -0.6782 | No | ||
| 36 | SLC12A2 | 4610019 6040672 | 15470 | -0.070 | -0.6995 | No | ||
| 37 | RNF111 | 2970072 3140112 5130647 | 15499 | -0.072 | -0.6961 | No | ||
| 38 | P4HB | 6110056 | 16003 | -0.117 | -0.7150 | Yes | ||
| 39 | KPNA3 | 7040088 | 16100 | -0.126 | -0.7115 | Yes | ||
| 40 | ELOVL6 | 5340746 | 16349 | -0.161 | -0.7137 | Yes | ||
| 41 | TOMM70A | 780114 | 16474 | -0.184 | -0.7077 | Yes | ||
| 42 | PTEN | 3390064 | 16640 | -0.215 | -0.7017 | Yes | ||
| 43 | SFRS7 | 2760408 | 16712 | -0.232 | -0.6895 | Yes | ||
| 44 | RAB6IP1 | 4150044 | 17219 | -0.361 | -0.6918 | Yes | ||
| 45 | EPC2 | 2470095 | 17424 | -0.427 | -0.6733 | Yes | ||
| 46 | CRKL | 4050427 | 17522 | -0.462 | -0.6466 | Yes | ||
| 47 | SOX4 | 2260091 | 17766 | -0.562 | -0.6208 | Yes | ||
| 48 | ACACA | 2490612 2680369 | 18033 | -0.701 | -0.5867 | Yes | ||
| 49 | EIF4A1 | 1990341 2810300 | 18156 | -0.798 | -0.5381 | Yes | ||
| 50 | RAP2C | 1690132 | 18260 | -0.898 | -0.4816 | Yes | ||
| 51 | BCL11B | 2680673 | 18267 | -0.908 | -0.4191 | Yes | ||
| 52 | TRIP12 | 130154 5080288 5720446 | 18279 | -0.919 | -0.3562 | Yes | ||
| 53 | MBNL1 | 2640762 7100048 | 18303 | -0.941 | -0.2924 | Yes | ||
| 54 | RAB14 | 6860139 | 18356 | -1.015 | -0.2250 | Yes | ||
| 55 | H3F3B | 1410300 | 18492 | -1.379 | -0.1370 | Yes | ||
| 56 | ILF3 | 940722 3190647 6520110 | 18576 | -2.079 | 0.0022 | Yes |

