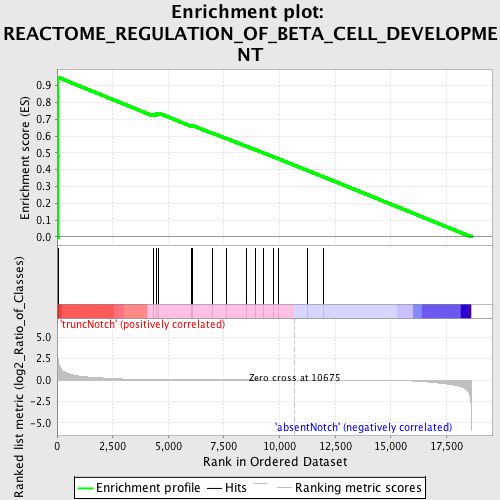
Profile of the Running ES Score & Positions of GeneSet Members on the Rank Ordered List
| Dataset | Set_03_absentNotch_versus_truncNotch.phenotype_absentNotch_versus_truncNotch.cls #truncNotch_versus_absentNotch |
| Phenotype | phenotype_absentNotch_versus_truncNotch.cls#truncNotch_versus_absentNotch |
| Upregulated in class | truncNotch |
| GeneSet | REACTOME_REGULATION_OF_BETA_CELL_DEVELOPMENT |
| Enrichment Score (ES) | 0.94785655 |
| Normalized Enrichment Score (NES) | 1.6944766 |
| Nominal p-value | 0.0 |
| FDR q-value | 0.09854008 |
| FWER p-Value | 0.119 |
| PROBE | DESCRIPTION (from dataset) | GENE SYMBOL | GENE_TITLE | RANK IN GENE LIST | RANK METRIC SCORE | RUNNING ES | CORE ENRICHMENT | |
|---|---|---|---|---|---|---|---|---|
| 1 | NOTCH1 | 3390114 | 66 | 2.087 | 0.4774 | Yes | ||
| 2 | HES1 | 4810280 | 69 | 2.042 | 0.9479 | Yes | ||
| 3 | NEUROD1 | 3060619 | 4321 | 0.047 | 0.7301 | No | ||
| 4 | IAPP | 4230040 | 4451 | 0.043 | 0.7332 | No | ||
| 5 | SLC2A2 | 5130537 5720722 6770079 | 4575 | 0.040 | 0.7358 | No | ||
| 6 | FOXA3 | 2680121 | 6057 | 0.018 | 0.6604 | No | ||
| 7 | PTF1A | 6450377 | 6096 | 0.018 | 0.6625 | No | ||
| 8 | FGF10 | 730458 840706 | 6998 | 0.012 | 0.6168 | No | ||
| 9 | NKX6-1 | 6040731 | 7598 | 0.009 | 0.5866 | No | ||
| 10 | PDX1 | 6660647 | 8499 | 0.006 | 0.5396 | No | ||
| 11 | INSM1 | 3450671 | 8929 | 0.005 | 0.5176 | No | ||
| 12 | NKX2-2 | 4150731 | 9259 | 0.004 | 0.5007 | No | ||
| 13 | ONECUT3 | 5720487 6100037 | 9739 | 0.002 | 0.4755 | No | ||
| 14 | PAX4 | 6620619 | 9954 | 0.002 | 0.4644 | No | ||
| 15 | AKT1 | 5290746 | 11232 | -0.001 | 0.3961 | No | ||
| 16 | HNF4G | 5720451 | 11993 | -0.004 | 0.3561 | No |

