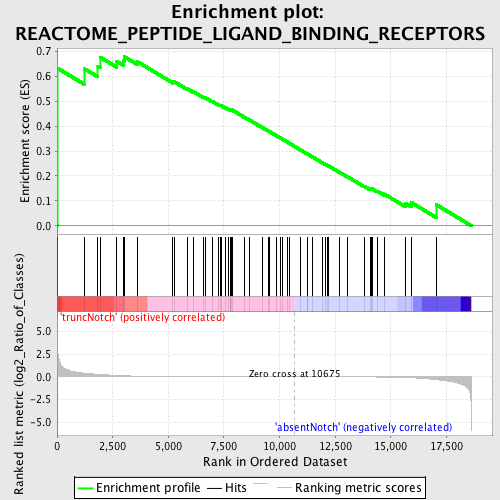
Profile of the Running ES Score & Positions of GeneSet Members on the Rank Ordered List
| Dataset | Set_03_absentNotch_versus_truncNotch.phenotype_absentNotch_versus_truncNotch.cls #truncNotch_versus_absentNotch |
| Phenotype | phenotype_absentNotch_versus_truncNotch.cls#truncNotch_versus_absentNotch |
| Upregulated in class | truncNotch |
| GeneSet | REACTOME_PEPTIDE_LIGAND_BINDING_RECEPTORS |
| Enrichment Score (ES) | 0.67862576 |
| Normalized Enrichment Score (NES) | 1.4865494 |
| Nominal p-value | 0.017681729 |
| FDR q-value | 0.43246582 |
| FWER p-Value | 1.0 |
| PROBE | DESCRIPTION (from dataset) | GENE SYMBOL | GENE_TITLE | RANK IN GENE LIST | RANK METRIC SCORE | RUNNING ES | CORE ENRICHMENT | |
|---|---|---|---|---|---|---|---|---|
| 1 | GAL | 3930279 | 15 | 3.926 | 0.6332 | Yes | ||
| 2 | CCR7 | 2060687 | 1240 | 0.388 | 0.6300 | Yes | ||
| 3 | F2 | 5720280 | 1835 | 0.270 | 0.6416 | Yes | ||
| 4 | NMB | 3360735 | 1940 | 0.252 | 0.6768 | Yes | ||
| 5 | NTSR1 | 6510136 | 2685 | 0.148 | 0.6606 | Yes | ||
| 6 | EDNRA | 6900133 | 2996 | 0.114 | 0.6623 | Yes | ||
| 7 | PDYN | 5720408 | 3029 | 0.112 | 0.6786 | Yes | ||
| 8 | BDKRB1 | 730592 | 3600 | 0.073 | 0.6596 | No | ||
| 9 | MC5R | 2640176 | 5203 | 0.028 | 0.5779 | No | ||
| 10 | AGT | 7000575 | 5282 | 0.027 | 0.5780 | No | ||
| 11 | AVPR2 | 360064 | 5859 | 0.020 | 0.5503 | No | ||
| 12 | KNG1 | 6400576 6770347 | 6117 | 0.018 | 0.5393 | No | ||
| 13 | CX3CL1 | 3990707 | 6572 | 0.014 | 0.5171 | No | ||
| 14 | PNOC | 1990114 | 6654 | 0.014 | 0.5150 | No | ||
| 15 | IL8RA | 1580100 | 6970 | 0.012 | 0.4999 | No | ||
| 16 | AGTR1 | 4780524 2680592 | 7271 | 0.010 | 0.4855 | No | ||
| 17 | NPFF | 2030280 | 7344 | 0.010 | 0.4832 | No | ||
| 18 | DARC | 3940050 | 7383 | 0.010 | 0.4827 | No | ||
| 19 | OXT | 3850692 | 7569 | 0.009 | 0.4742 | No | ||
| 20 | CCKBR | 2760128 | 7703 | 0.009 | 0.4684 | No | ||
| 21 | HCRTR2 | 2350463 | 7783 | 0.008 | 0.4655 | No | ||
| 22 | TACR3 | 4780017 | 7805 | 0.008 | 0.4657 | No | ||
| 23 | CCR3 | 50427 | 7836 | 0.008 | 0.4654 | No | ||
| 24 | HCRT | 2970463 | 7861 | 0.008 | 0.4654 | No | ||
| 25 | GALR1 | 6020452 | 8425 | 0.006 | 0.4361 | No | ||
| 26 | TAC1 | 7000195 380706 | 8648 | 0.005 | 0.4250 | No | ||
| 27 | MC2R | 2970504 | 9228 | 0.004 | 0.3944 | No | ||
| 28 | AVPR1A | 2120300 | 9503 | 0.003 | 0.3801 | No | ||
| 29 | CCR6 | 5720368 6020176 | 9558 | 0.003 | 0.3776 | No | ||
| 30 | EDN1 | 1770047 | 9874 | 0.002 | 0.3610 | No | ||
| 31 | PPYR1 | 1410072 | 10050 | 0.002 | 0.3518 | No | ||
| 32 | OPRM1 | 5360279 | 10143 | 0.001 | 0.3471 | No | ||
| 33 | SST | 6590142 | 10356 | 0.001 | 0.3358 | No | ||
| 34 | GRPR | 6020170 | 10462 | 0.000 | 0.3302 | No | ||
| 35 | TACR2 | 1740358 | 10945 | -0.001 | 0.3044 | No | ||
| 36 | CCK | 6370368 | 11271 | -0.002 | 0.2871 | No | ||
| 37 | NTS | 380300 2120592 | 11275 | -0.002 | 0.2872 | No | ||
| 38 | PPY | 2340373 | 11495 | -0.002 | 0.2757 | No | ||
| 39 | TACR1 | 70358 3840411 | 11949 | -0.004 | 0.2519 | No | ||
| 40 | HCRTR1 | 1580273 | 12055 | -0.004 | 0.2469 | No | ||
| 41 | XCR1 | 5080072 | 12160 | -0.004 | 0.2419 | No | ||
| 42 | SSTR1 | 2630471 | 12202 | -0.004 | 0.2404 | No | ||
| 43 | C5AR1 | 4540402 | 12688 | -0.006 | 0.2153 | No | ||
| 44 | CCR10 | 4050097 | 13047 | -0.008 | 0.1973 | No | ||
| 45 | CXCR6 | 3190440 | 13812 | -0.014 | 0.1584 | No | ||
| 46 | CXCL11 | 1090551 | 14075 | -0.017 | 0.1470 | No | ||
| 47 | KISS1 | 1580398 | 14111 | -0.018 | 0.1479 | No | ||
| 48 | XCL1 | 3800504 | 14159 | -0.018 | 0.1483 | No | ||
| 49 | IL8RB | 450592 1170537 | 14391 | -0.023 | 0.1395 | No | ||
| 50 | AVP | 2100113 | 14708 | -0.032 | 0.1277 | No | ||
| 51 | CCL25 | 450541 540435 | 15668 | -0.084 | 0.0896 | No | ||
| 52 | F2R | 4810180 | 15920 | -0.107 | 0.0934 | No | ||
| 53 | CCL5 | 3710397 | 17054 | -0.321 | 0.0841 | No |

