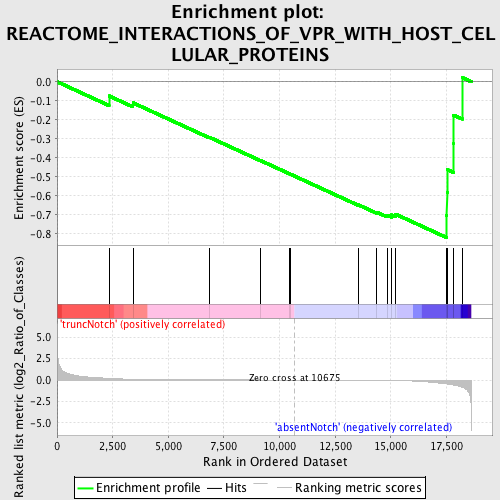
Profile of the Running ES Score & Positions of GeneSet Members on the Rank Ordered List
| Dataset | Set_03_absentNotch_versus_truncNotch.phenotype_absentNotch_versus_truncNotch.cls #truncNotch_versus_absentNotch |
| Phenotype | phenotype_absentNotch_versus_truncNotch.cls#truncNotch_versus_absentNotch |
| Upregulated in class | absentNotch |
| GeneSet | REACTOME_INTERACTIONS_OF_VPR_WITH_HOST_CELLULAR_PROTEINS |
| Enrichment Score (ES) | -0.81954956 |
| Normalized Enrichment Score (NES) | -1.5283995 |
| Nominal p-value | 0.013592233 |
| FDR q-value | 0.340678 |
| FWER p-Value | 0.979 |
| PROBE | DESCRIPTION (from dataset) | GENE SYMBOL | GENE_TITLE | RANK IN GENE LIST | RANK METRIC SCORE | RUNNING ES | CORE ENRICHMENT | |
|---|---|---|---|---|---|---|---|---|
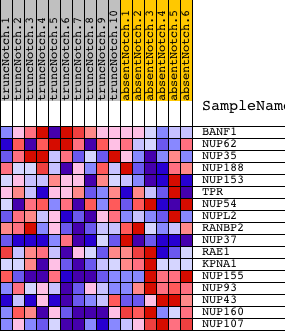
| 1 | BANF1 | 460164 2850170 6110139 | 2335 | 0.196 | -0.0747 | No | ||
| 2 | NUP62 | 1240128 | 3411 | 0.083 | -0.1109 | No | ||
| 3 | NUP35 | 5340408 | 6853 | 0.012 | -0.2927 | No | ||
| 4 | NUP188 | 1190470 | 9120 | 0.004 | -0.4135 | No | ||
| 5 | NUP153 | 7000452 | 10431 | 0.001 | -0.4838 | No | ||
| 6 | TPR | 1990066 6550390 | 10504 | 0.000 | -0.4875 | No | ||
| 7 | NUP54 | 940546 2360156 4060278 | 13537 | -0.011 | -0.6477 | No | ||
| 8 | NUPL2 | 6550537 | 14364 | -0.022 | -0.6864 | No | ||
| 9 | RANBP2 | 4280338 | 14838 | -0.036 | -0.7024 | Yes | ||
| 10 | NUP37 | 2370097 6370435 6380008 | 15029 | -0.045 | -0.7010 | Yes | ||
| 11 | RAE1 | 7050121 | 15199 | -0.053 | -0.6962 | Yes | ||
| 12 | KPNA1 | 5270324 | 17494 | -0.453 | -0.7018 | Yes | ||
| 13 | NUP155 | 5720576 6220114 | 17525 | -0.462 | -0.5834 | Yes | ||
| 14 | NUP93 | 2190273 | 17535 | -0.467 | -0.4625 | Yes | ||
| 15 | NUP43 | 3360482 | 17810 | -0.580 | -0.3267 | Yes | ||
| 16 | NUP160 | 1990551 | 17817 | -0.584 | -0.1753 | Yes | ||
| 17 | NUP107 | 6380021 | 18209 | -0.840 | 0.0219 | Yes |