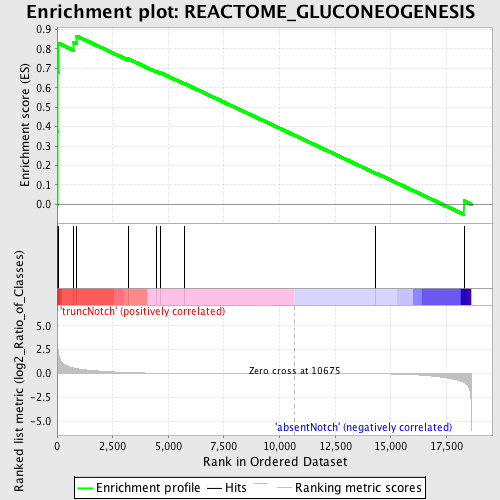
Profile of the Running ES Score & Positions of GeneSet Members on the Rank Ordered List
| Dataset | Set_03_absentNotch_versus_truncNotch.phenotype_absentNotch_versus_truncNotch.cls #truncNotch_versus_absentNotch |
| Phenotype | phenotype_absentNotch_versus_truncNotch.cls#truncNotch_versus_absentNotch |
| Upregulated in class | truncNotch |
| GeneSet | REACTOME_GLUCONEOGENESIS |
| Enrichment Score (ES) | 0.86621994 |
| Normalized Enrichment Score (NES) | 1.4528097 |
| Nominal p-value | 0.03508772 |
| FDR q-value | 0.4879647 |
| FWER p-Value | 1.0 |
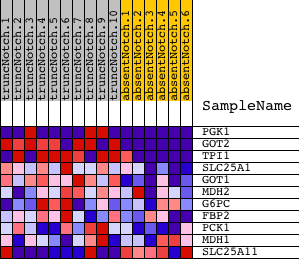
| PROBE | DESCRIPTION (from dataset) | GENE SYMBOL | GENE_TITLE | RANK IN GENE LIST | RANK METRIC SCORE | RUNNING ES | CORE ENRICHMENT | |
|---|---|---|---|---|---|---|---|---|
| 1 | PGK1 | 1570494 630300 | 6 | 5.004 | 0.3768 | Yes | ||
| 2 | GOT2 | 4570164 5220450 | 14 | 4.022 | 0.6796 | Yes | ||
| 3 | TPI1 | 1500215 2100154 | 70 | 2.022 | 0.8290 | Yes | ||
| 4 | SLC25A1 | 4050402 | 750 | 0.569 | 0.8354 | Yes | ||
| 5 | GOT1 | 2940465 | 883 | 0.503 | 0.8662 | Yes | ||
| 6 | MDH2 | 1850601 | 3193 | 0.097 | 0.7494 | No | ||
| 7 | G6PC | 430093 | 4461 | 0.043 | 0.6846 | No | ||
| 8 | FBP2 | 1580193 | 4630 | 0.039 | 0.6785 | No | ||
| 9 | PCK1 | 7000358 | 5722 | 0.022 | 0.6215 | No | ||
| 10 | MDH1 | 6660358 6760731 | 14319 | -0.021 | 0.1610 | No | ||
| 11 | SLC25A11 | 130097 770685 | 18289 | -0.927 | 0.0176 | No |