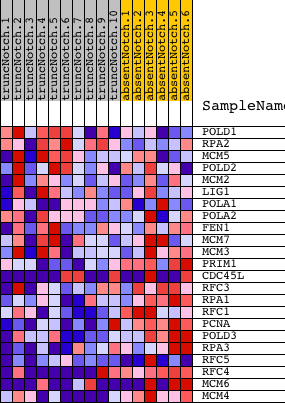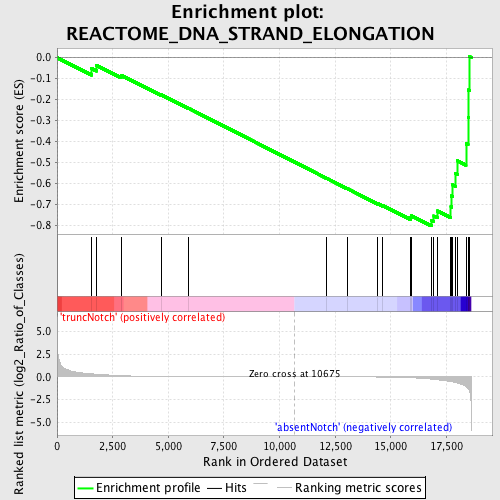
Profile of the Running ES Score & Positions of GeneSet Members on the Rank Ordered List
| Dataset | Set_03_absentNotch_versus_truncNotch.phenotype_absentNotch_versus_truncNotch.cls #truncNotch_versus_absentNotch |
| Phenotype | phenotype_absentNotch_versus_truncNotch.cls#truncNotch_versus_absentNotch |
| Upregulated in class | absentNotch |
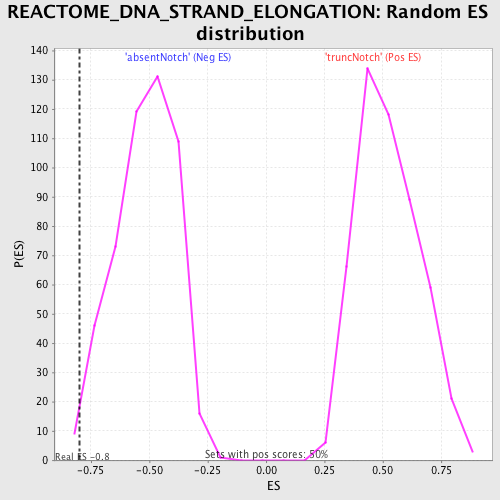
| GeneSet | REACTOME_DNA_STRAND_ELONGATION |
| Enrichment Score (ES) | -0.80131626 |
| Normalized Enrichment Score (NES) | -1.5514646 |
| Nominal p-value | 0.011904762 |
| FDR q-value | 0.2878441 |
| FWER p-Value | 0.945 |
| PROBE | DESCRIPTION (from dataset) | GENE SYMBOL | GENE_TITLE | RANK IN GENE LIST | RANK METRIC SCORE | RUNNING ES | CORE ENRICHMENT | |
|---|---|---|---|---|---|---|---|---|
| 1 | POLD1 | 4830026 | 1543 | 0.322 | -0.0517 | No | ||
| 2 | RPA2 | 2760301 5420195 | 1771 | 0.280 | -0.0367 | No | ||
| 3 | MCM5 | 2680647 | 2877 | 0.127 | -0.0837 | No | ||
| 4 | POLD2 | 6400148 | 4685 | 0.038 | -0.1773 | No | ||
| 5 | MCM2 | 5050139 | 5911 | 0.020 | -0.2412 | No | ||
| 6 | LIG1 | 1980438 4540112 5570609 | 12106 | -0.004 | -0.5739 | No | ||
| 7 | POLA1 | 4760541 | 13046 | -0.008 | -0.6237 | No | ||
| 8 | POLA2 | 940519 | 14416 | -0.023 | -0.6950 | No | ||
| 9 | FEN1 | 1770541 | 14640 | -0.029 | -0.7042 | No | ||
| 10 | MCM7 | 3290292 5220056 | 15883 | -0.103 | -0.7609 | No | ||
| 11 | MCM3 | 5570068 | 15925 | -0.107 | -0.7526 | No | ||
| 12 | PRIM1 | 6420746 | 16831 | -0.261 | -0.7759 | Yes | ||
| 13 | CDC45L | 70537 3130114 | 16937 | -0.285 | -0.7538 | Yes | ||
| 14 | RFC3 | 1980600 | 17089 | -0.329 | -0.7298 | Yes | ||
| 15 | RPA1 | 360452 | 17702 | -0.539 | -0.7102 | Yes | ||
| 16 | RFC1 | 1190673 | 17728 | -0.547 | -0.6583 | Yes | ||
| 17 | PCNA | 940754 | 17783 | -0.569 | -0.6058 | Yes | ||
| 18 | POLD3 | 6400278 | 17894 | -0.624 | -0.5509 | Yes | ||
| 19 | RPA3 | 5700136 | 17986 | -0.672 | -0.4904 | Yes | ||
| 20 | RFC5 | 3800452 6020091 | 18380 | -1.048 | -0.4095 | Yes | ||
| 21 | RFC4 | 3800082 6840142 | 18471 | -1.314 | -0.2864 | Yes | ||
| 22 | MCM6 | 60092 540181 6510110 | 18488 | -1.370 | -0.1539 | Yes | ||
| 23 | MCM4 | 2760673 5420711 | 18548 | -1.651 | 0.0037 | Yes |