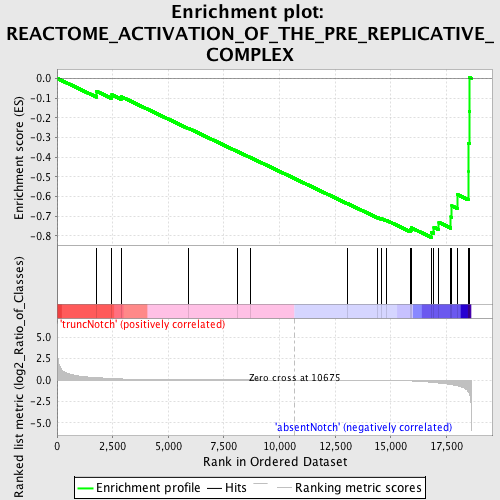
Profile of the Running ES Score & Positions of GeneSet Members on the Rank Ordered List
| Dataset | Set_03_absentNotch_versus_truncNotch.phenotype_absentNotch_versus_truncNotch.cls #truncNotch_versus_absentNotch |
| Phenotype | phenotype_absentNotch_versus_truncNotch.cls#truncNotch_versus_absentNotch |
| Upregulated in class | absentNotch |
| GeneSet | REACTOME_ACTIVATION_OF_THE_PRE_REPLICATIVE_COMPLEX |
| Enrichment Score (ES) | -0.80763304 |
| Normalized Enrichment Score (NES) | -1.558289 |
| Nominal p-value | 0.011764706 |
| FDR q-value | 0.30909422 |
| FWER p-Value | 0.931 |
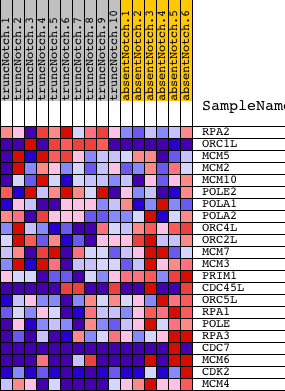
| PROBE | DESCRIPTION (from dataset) | GENE SYMBOL | GENE_TITLE | RANK IN GENE LIST | RANK METRIC SCORE | RUNNING ES | CORE ENRICHMENT | |
|---|---|---|---|---|---|---|---|---|
| 1 | RPA2 | 2760301 5420195 | 1771 | 0.280 | -0.0658 | No | ||
| 2 | ORC1L | 2370328 6110390 | 2462 | 0.179 | -0.0841 | No | ||
| 3 | MCM5 | 2680647 | 2877 | 0.127 | -0.0930 | No | ||
| 4 | MCM2 | 5050139 | 5911 | 0.020 | -0.2540 | No | ||
| 5 | MCM10 | 4920632 | 8085 | 0.007 | -0.3701 | No | ||
| 6 | POLE2 | 6110041 | 8706 | 0.005 | -0.4029 | No | ||
| 7 | POLA1 | 4760541 | 13046 | -0.008 | -0.6354 | No | ||
| 8 | POLA2 | 940519 | 14416 | -0.023 | -0.7066 | No | ||
| 9 | ORC4L | 4230538 5550288 | 14561 | -0.027 | -0.7115 | No | ||
| 10 | ORC2L | 1990470 6510019 | 14795 | -0.035 | -0.7204 | No | ||
| 11 | MCM7 | 3290292 5220056 | 15883 | -0.103 | -0.7680 | No | ||
| 12 | MCM3 | 5570068 | 15925 | -0.107 | -0.7590 | No | ||
| 13 | PRIM1 | 6420746 | 16831 | -0.261 | -0.7802 | Yes | ||
| 14 | CDC45L | 70537 3130114 | 16937 | -0.285 | -0.7559 | Yes | ||
| 15 | ORC5L | 1940133 1940711 | 17162 | -0.347 | -0.7315 | Yes | ||
| 16 | RPA1 | 360452 | 17702 | -0.539 | -0.7037 | Yes | ||
| 17 | POLE | 6020538 | 17744 | -0.554 | -0.6477 | Yes | ||
| 18 | RPA3 | 5700136 | 17986 | -0.672 | -0.5900 | Yes | ||
| 19 | CDC7 | 4060546 4850041 | 18483 | -1.359 | -0.4738 | Yes | ||
| 20 | MCM6 | 60092 540181 6510110 | 18488 | -1.370 | -0.3300 | Yes | ||
| 21 | CDK2 | 130484 2260301 4010088 5050110 | 18532 | -1.554 | -0.1690 | Yes | ||
| 22 | MCM4 | 2760673 5420711 | 18548 | -1.651 | 0.0037 | Yes |