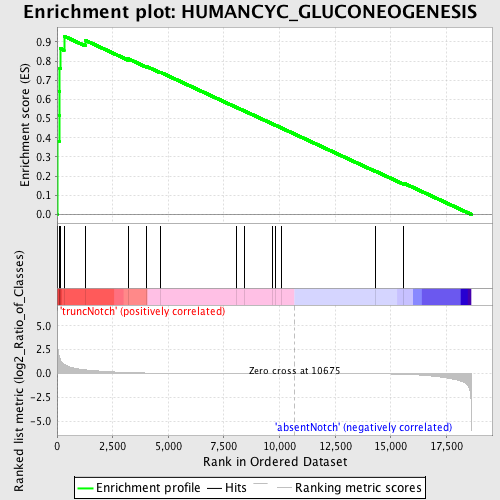
Profile of the Running ES Score & Positions of GeneSet Members on the Rank Ordered List
| Dataset | Set_03_absentNotch_versus_truncNotch.phenotype_absentNotch_versus_truncNotch.cls #truncNotch_versus_absentNotch |
| Phenotype | phenotype_absentNotch_versus_truncNotch.cls#truncNotch_versus_absentNotch |
| Upregulated in class | truncNotch |
| GeneSet | HUMANCYC_GLUCONEOGENESIS |
| Enrichment Score (ES) | 0.93042266 |
| Normalized Enrichment Score (NES) | 1.6901381 |
| Nominal p-value | 0.0 |
| FDR q-value | 0.055872794 |
| FWER p-Value | 0.135 |
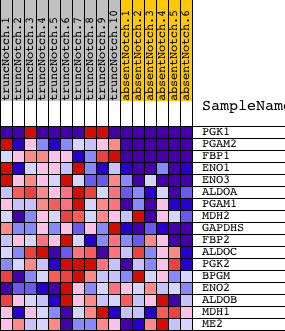
| PROBE | DESCRIPTION (from dataset) | GENE SYMBOL | GENE_TITLE | RANK IN GENE LIST | RANK METRIC SCORE | RUNNING ES | CORE ENRICHMENT | |
|---|---|---|---|---|---|---|---|---|
| 1 | PGK1 | 1570494 630300 | 6 | 5.004 | 0.3825 | Yes | ||
| 2 | PGAM2 | 3610605 | 92 | 1.782 | 0.5143 | Yes | ||
| 3 | FBP1 | 1470762 | 102 | 1.688 | 0.6430 | Yes | ||
| 4 | ENO1 | 5340128 | 122 | 1.566 | 0.7618 | Yes | ||
| 5 | ENO3 | 5270136 | 158 | 1.372 | 0.8649 | Yes | ||
| 6 | ALDOA | 6290672 | 312 | 0.964 | 0.9304 | Yes | ||
| 7 | PGAM1 | 2570133 | 1266 | 0.383 | 0.9085 | No | ||
| 8 | MDH2 | 1850601 | 3193 | 0.097 | 0.8123 | No | ||
| 9 | GAPDHS | 2690463 | 4008 | 0.056 | 0.7729 | No | ||
| 10 | FBP2 | 1580193 | 4630 | 0.039 | 0.7424 | No | ||
| 11 | ALDOC | 450121 610427 | 8041 | 0.007 | 0.5597 | No | ||
| 12 | PGK2 | 2650091 | 8409 | 0.006 | 0.5404 | No | ||
| 13 | BPGM | 5080520 | 9659 | 0.003 | 0.4734 | No | ||
| 14 | ENO2 | 2320068 | 9801 | 0.002 | 0.4660 | No | ||
| 15 | ALDOB | 4730324 | 10064 | 0.001 | 0.4521 | No | ||
| 16 | MDH1 | 6660358 6760731 | 14319 | -0.021 | 0.2250 | No | ||
| 17 | ME2 | 5080121 | 15587 | -0.078 | 0.1628 | No |