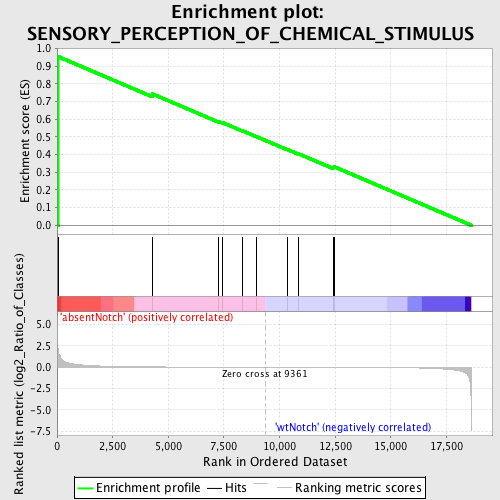
Profile of the Running ES Score & Positions of GeneSet Members on the Rank Ordered List
| Dataset | Set_03_absentNotch_versus_wtNotch.phenotype_absentNotch_versus_wtNotch.cls #absentNotch_versus_wtNotch.phenotype_absentNotch_versus_wtNotch.cls #absentNotch_versus_wtNotch_repos |
| Phenotype | phenotype_absentNotch_versus_wtNotch.cls#absentNotch_versus_wtNotch_repos |
| Upregulated in class | absentNotch |
| GeneSet | SENSORY_PERCEPTION_OF_CHEMICAL_STIMULUS |
| Enrichment Score (ES) | 0.95319796 |
| Normalized Enrichment Score (NES) | 1.5595614 |
| Nominal p-value | 0.0020408162 |
| FDR q-value | 1.0 |
| FWER p-Value | 0.992 |
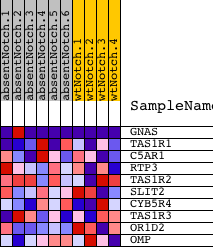
| PROBE | DESCRIPTION (from dataset) | GENE SYMBOL | GENE_TITLE | RANK IN GENE LIST | RANK METRIC SCORE | RUNNING ES | CORE ENRICHMENT | |
|---|---|---|---|---|---|---|---|---|
| 1 | GNAS | 630441 1850373 4050152 | 73 | 1.512 | 0.9532 | Yes | ||
| 2 | TAS1R1 | 430148 | 4286 | 0.026 | 0.7433 | No | ||
| 3 | C5AR1 | 4540402 | 7264 | 0.006 | 0.5870 | No | ||
| 4 | RTP3 | 2260176 | 7420 | 0.005 | 0.5821 | No | ||
| 5 | TAS1R2 | 4850072 | 8339 | 0.003 | 0.5344 | No | ||
| 6 | SLIT2 | 1940037 | 8953 | 0.001 | 0.5021 | No | ||
| 7 | CYB5R4 | 2260601 4610450 | 10351 | -0.003 | 0.4287 | No | ||
| 8 | TAS1R3 | 360136 | 10862 | -0.004 | 0.4039 | No | ||
| 9 | OR1D2 | 3130333 | 12403 | -0.010 | 0.3274 | No | ||
| 10 | OMP | 540364 | 12451 | -0.010 | 0.3313 | No |