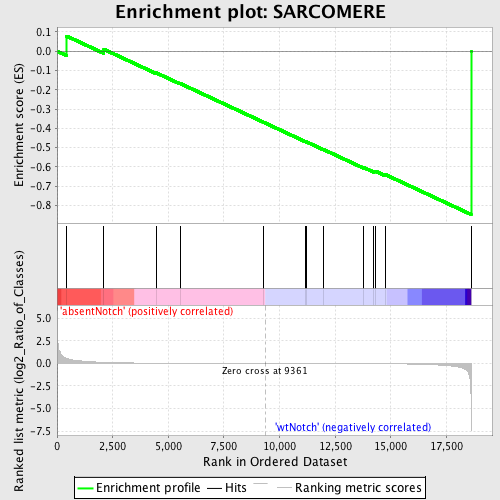
Profile of the Running ES Score & Positions of GeneSet Members on the Rank Ordered List
| Dataset | Set_03_absentNotch_versus_wtNotch.phenotype_absentNotch_versus_wtNotch.cls #absentNotch_versus_wtNotch.phenotype_absentNotch_versus_wtNotch.cls #absentNotch_versus_wtNotch_repos |
| Phenotype | phenotype_absentNotch_versus_wtNotch.cls#absentNotch_versus_wtNotch_repos |
| Upregulated in class | wtNotch |
| GeneSet | SARCOMERE |
| Enrichment Score (ES) | -0.8475855 |
| Normalized Enrichment Score (NES) | -1.466175 |
| Nominal p-value | 0.037113402 |
| FDR q-value | 0.9844911 |
| FWER p-Value | 1.0 |
| PROBE | DESCRIPTION (from dataset) | GENE SYMBOL | GENE_TITLE | RANK IN GENE LIST | RANK METRIC SCORE | RUNNING ES | CORE ENRICHMENT | |
|---|---|---|---|---|---|---|---|---|
| 1 | TPM4 | 2100059 3850072 4920162 | 433 | 0.562 | 0.0784 | No | ||
| 2 | TPM2 | 520735 3870390 | 2100 | 0.117 | 0.0101 | No | ||
| 3 | MYOZ2 | 1050253 | 4461 | 0.024 | -0.1125 | No | ||
| 4 | MYOM1 | 580091 | 5532 | 0.014 | -0.1675 | No | ||
| 5 | DES | 1450341 | 9284 | 0.000 | -0.3691 | No | ||
| 6 | NEB | 580735 | 11167 | -0.005 | -0.4694 | No | ||
| 7 | ACTA1 | 840538 | 11213 | -0.005 | -0.4709 | No | ||
| 8 | TTN | 2320161 4670056 6550026 | 11954 | -0.008 | -0.5092 | No | ||
| 9 | TNNT2 | 2450364 | 13780 | -0.020 | -0.6037 | No | ||
| 10 | TPM1 | 130673 | 14232 | -0.025 | -0.6234 | No | ||
| 11 | TNNC1 | 1990575 | 14301 | -0.026 | -0.6223 | No | ||
| 12 | TNNI3 | 7000093 | 14738 | -0.034 | -0.6396 | Yes | ||
| 13 | TPM3 | 670600 3170296 5670167 6650471 | 18609 | -4.686 | 0.0004 | Yes |

