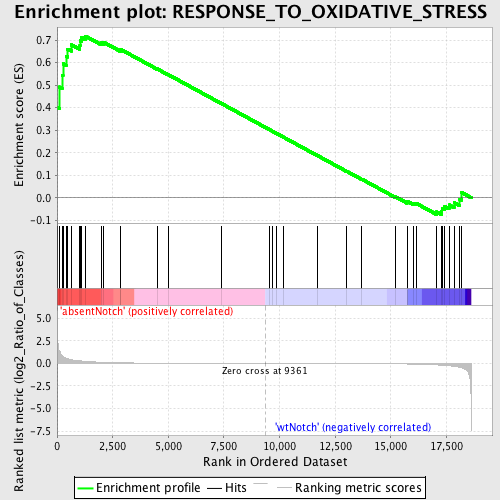
Profile of the Running ES Score & Positions of GeneSet Members on the Rank Ordered List
| Dataset | Set_03_absentNotch_versus_wtNotch.phenotype_absentNotch_versus_wtNotch.cls #absentNotch_versus_wtNotch.phenotype_absentNotch_versus_wtNotch.cls #absentNotch_versus_wtNotch_repos |
| Phenotype | phenotype_absentNotch_versus_wtNotch.cls#absentNotch_versus_wtNotch_repos |
| Upregulated in class | absentNotch |
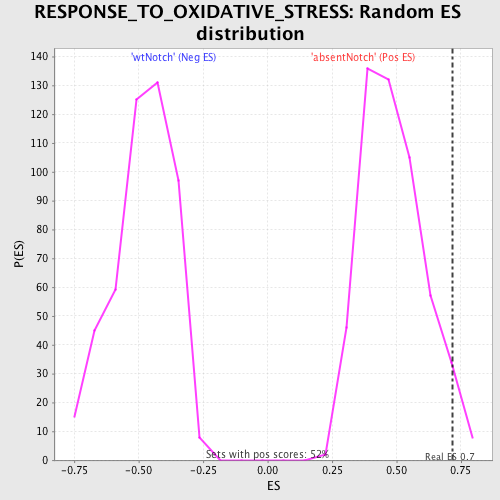
| GeneSet | RESPONSE_TO_OXIDATIVE_STRESS |
| Enrichment Score (ES) | 0.7179848 |
| Normalized Enrichment Score (NES) | 1.4835168 |
| Nominal p-value | 0.04423077 |
| FDR q-value | 1.0 |
| FWER p-Value | 1.0 |
| PROBE | DESCRIPTION (from dataset) | GENE SYMBOL | GENE_TITLE | RANK IN GENE LIST | RANK METRIC SCORE | RUNNING ES | CORE ENRICHMENT | |
|---|---|---|---|---|---|---|---|---|
| 1 | PRDX2 | 6760095 4010619 5340577 | 0 | 5.791 | 0.4006 | Yes | ||
| 2 | DUSP1 | 6860121 | 96 | 1.398 | 0.4921 | Yes | ||
| 3 | ERCC8 | 1240300 6450372 6590180 | 226 | 0.863 | 0.5449 | Yes | ||
| 4 | PRDX5 | 1660592 2030091 | 267 | 0.771 | 0.5961 | Yes | ||
| 5 | CCL5 | 3710397 | 407 | 0.579 | 0.6286 | Yes | ||
| 6 | PRNP | 3140687 | 475 | 0.510 | 0.6603 | Yes | ||
| 7 | SEPP1 | 450273 | 637 | 0.408 | 0.6799 | Yes | ||
| 8 | GLRX2 | 940433 | 1023 | 0.278 | 0.6784 | Yes | ||
| 9 | SCARA3 | 5890487 | 1035 | 0.276 | 0.6969 | Yes | ||
| 10 | GCLM | 4230270 | 1087 | 0.262 | 0.7123 | Yes | ||
| 11 | NDUFS2 | 4850020 6200402 | 1272 | 0.226 | 0.7180 | Yes | ||
| 12 | NDUFA6 | 3990348 | 1993 | 0.126 | 0.6879 | No | ||
| 13 | APTX | 3360041 4560167 | 2102 | 0.117 | 0.6902 | No | ||
| 14 | SRXN1 | 630731 3130195 4480239 | 2836 | 0.068 | 0.6555 | No | ||
| 15 | MPO | 2360176 2760440 5690176 | 2856 | 0.067 | 0.6591 | No | ||
| 16 | PDLIM1 | 450100 | 4494 | 0.023 | 0.5726 | No | ||
| 17 | ERCC2 | 2360750 4060390 6550138 | 4987 | 0.018 | 0.5473 | No | ||
| 18 | NUDT1 | 2850600 | 7370 | 0.006 | 0.4195 | No | ||
| 19 | MSRA | 4570411 | 9537 | -0.000 | 0.3030 | No | ||
| 20 | SGK2 | 1850070 | 9683 | -0.001 | 0.2952 | No | ||
| 21 | PRDX6 | 4920397 6380601 | 9880 | -0.001 | 0.2848 | No | ||
| 22 | RNF7 | 2030242 | 10191 | -0.002 | 0.2682 | No | ||
| 23 | GCLC | 2810731 | 11719 | -0.007 | 0.1865 | No | ||
| 24 | APOA4 | 4120451 | 13004 | -0.013 | 0.1183 | No | ||
| 25 | NDUFB4 | 460348 5690594 | 13703 | -0.019 | 0.0821 | No | ||
| 26 | GPX3 | 1340450 | 15196 | -0.046 | 0.0049 | No | ||
| 27 | STK25 | 1090519 1500193 | 15729 | -0.066 | -0.0192 | No | ||
| 28 | SOD1 | 5890070 | 15752 | -0.067 | -0.0157 | No | ||
| 29 | TXNRD2 | 2510398 3780451 | 16021 | -0.081 | -0.0246 | No | ||
| 30 | NDUFS8 | 4150100 | 16150 | -0.088 | -0.0254 | No | ||
| 31 | ERCC3 | 6900008 | 17057 | -0.163 | -0.0629 | No | ||
| 32 | SOD2 | 1410053 | 17270 | -0.197 | -0.0606 | No | ||
| 33 | CYGB | 870347 | 17300 | -0.203 | -0.0482 | No | ||
| 34 | ATOX1 | 1090497 | 17414 | -0.222 | -0.0389 | No | ||
| 35 | ERCC1 | 3800010 4590132 4670397 | 17619 | -0.261 | -0.0318 | No | ||
| 36 | GSS | 6130465 6900398 | 17845 | -0.328 | -0.0212 | No | ||
| 37 | DHCR24 | 840600 1050672 6290097 | 18100 | -0.423 | -0.0057 | No | ||
| 38 | PNKP | 4610685 5720605 | 18188 | -0.483 | 0.0230 | No |