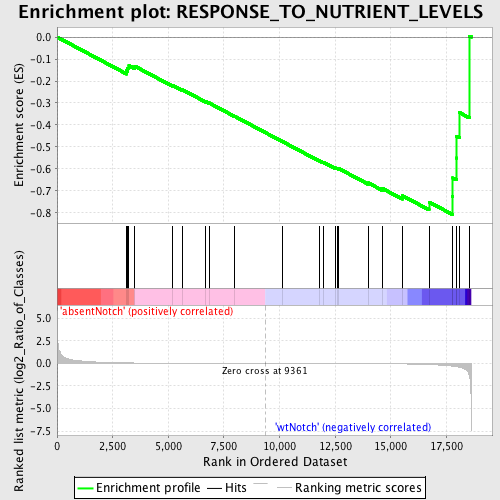
Profile of the Running ES Score & Positions of GeneSet Members on the Rank Ordered List
| Dataset | Set_03_absentNotch_versus_wtNotch.phenotype_absentNotch_versus_wtNotch.cls #absentNotch_versus_wtNotch.phenotype_absentNotch_versus_wtNotch.cls #absentNotch_versus_wtNotch_repos |
| Phenotype | phenotype_absentNotch_versus_wtNotch.cls#absentNotch_versus_wtNotch_repos |
| Upregulated in class | wtNotch |
| GeneSet | RESPONSE_TO_NUTRIENT_LEVELS |
| Enrichment Score (ES) | -0.8074493 |
| Normalized Enrichment Score (NES) | -1.5488085 |
| Nominal p-value | 0.020920502 |
| FDR q-value | 1.0 |
| FWER p-Value | 0.999 |
| PROBE | DESCRIPTION (from dataset) | GENE SYMBOL | GENE_TITLE | RANK IN GENE LIST | RANK METRIC SCORE | RUNNING ES | CORE ENRICHMENT | |
|---|---|---|---|---|---|---|---|---|
| 1 | GCGR | 6620497 | 3129 | 0.055 | -0.1533 | No | ||
| 2 | CDKN2B | 6020040 | 3172 | 0.053 | -0.1411 | No | ||
| 3 | PPARG | 1990168 2680603 6130632 | 3229 | 0.051 | -0.1302 | No | ||
| 4 | STC1 | 360161 | 3492 | 0.042 | -0.1327 | No | ||
| 5 | FADS1 | 5270537 | 5187 | 0.016 | -0.2194 | No | ||
| 6 | GHRL | 2360619 6760438 | 5640 | 0.013 | -0.2401 | No | ||
| 7 | GHSR | 1980465 7050521 | 6679 | 0.008 | -0.2937 | No | ||
| 8 | LEP | 4010053 | 6831 | 0.007 | -0.2998 | No | ||
| 9 | PCSK9 | 3120044 | 7976 | 0.004 | -0.3604 | No | ||
| 10 | CARTPT | 6660687 | 10152 | -0.002 | -0.4768 | No | ||
| 11 | ENSA | 6620546 | 11780 | -0.007 | -0.5623 | No | ||
| 12 | SST | 6590142 | 11982 | -0.008 | -0.5710 | No | ||
| 13 | CCKAR | 4210079 | 12494 | -0.010 | -0.5956 | No | ||
| 14 | ENPP1 | 780609 | 12580 | -0.011 | -0.5973 | No | ||
| 15 | SREBF1 | 4780333 | 12659 | -0.011 | -0.5985 | No | ||
| 16 | NPY | 3170138 | 13987 | -0.022 | -0.6638 | No | ||
| 17 | SSTR1 | 2630471 | 14617 | -0.032 | -0.6890 | No | ||
| 18 | STC2 | 4920601 | 15514 | -0.057 | -0.7216 | No | ||
| 19 | CHMP1A | 5550441 | 16718 | -0.130 | -0.7509 | Yes | ||
| 20 | OGT | 2360131 4610333 | 17770 | -0.304 | -0.7246 | Yes | ||
| 21 | CDKN2D | 6040035 | 17789 | -0.309 | -0.6412 | Yes | ||
| 22 | TULP4 | 2320364 | 17954 | -0.366 | -0.5503 | Yes | ||
| 23 | ASNS | 110368 7100687 | 17961 | -0.367 | -0.4505 | Yes | ||
| 24 | TP53 | 6130707 | 18087 | -0.415 | -0.3440 | Yes | ||
| 25 | SSTR2 | 4590687 | 18537 | -1.366 | 0.0042 | Yes |

