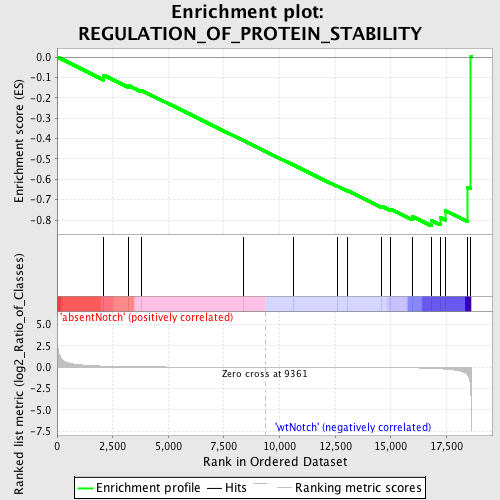
Profile of the Running ES Score & Positions of GeneSet Members on the Rank Ordered List
| Dataset | Set_03_absentNotch_versus_wtNotch.phenotype_absentNotch_versus_wtNotch.cls #absentNotch_versus_wtNotch.phenotype_absentNotch_versus_wtNotch.cls #absentNotch_versus_wtNotch_repos |
| Phenotype | phenotype_absentNotch_versus_wtNotch.cls#absentNotch_versus_wtNotch_repos |
| Upregulated in class | wtNotch |
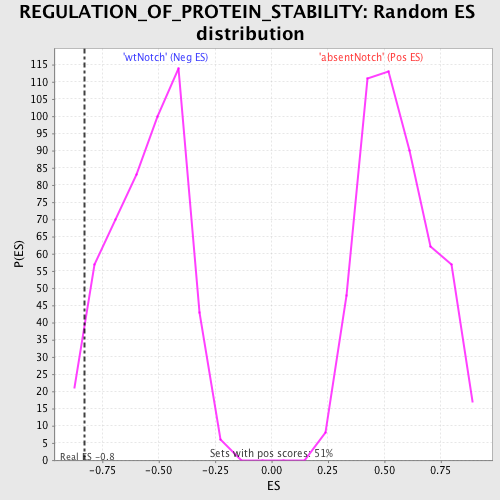
| GeneSet | REGULATION_OF_PROTEIN_STABILITY |
| Enrichment Score (ES) | -0.8289365 |
| Normalized Enrichment Score (NES) | -1.498679 |
| Nominal p-value | 0.042510122 |
| FDR q-value | 1.0 |
| FWER p-Value | 1.0 |
| PROBE | DESCRIPTION (from dataset) | GENE SYMBOL | GENE_TITLE | RANK IN GENE LIST | RANK METRIC SCORE | RUNNING ES | CORE ENRICHMENT | |
|---|---|---|---|---|---|---|---|---|
| 1 | APTX | 3360041 4560167 | 2102 | 0.117 | -0.0902 | No | ||
| 2 | APOA1 | 110152 | 3217 | 0.052 | -0.1400 | No | ||
| 3 | AURKA | 780537 | 3772 | 0.036 | -0.1629 | No | ||
| 4 | PPARGC1A | 4670040 | 8390 | 0.003 | -0.4105 | No | ||
| 5 | APOA2 | 6510364 6860411 | 10636 | -0.003 | -0.5306 | No | ||
| 6 | HPS4 | 6940110 | 12622 | -0.011 | -0.6351 | No | ||
| 7 | STX12 | 610451 | 13047 | -0.014 | -0.6553 | No | ||
| 8 | MDM4 | 4070504 4780008 | 14602 | -0.031 | -0.7327 | No | ||
| 9 | PTEN | 3390064 | 15006 | -0.040 | -0.7465 | No | ||
| 10 | COG7 | 360133 | 15960 | -0.077 | -0.7828 | No | ||
| 11 | GTPBP4 | 6840332 | 16820 | -0.138 | -0.8020 | Yes | ||
| 12 | FBXO7 | 2030397 | 17227 | -0.188 | -0.7872 | Yes | ||
| 13 | COG3 | 3840746 | 17464 | -0.231 | -0.7548 | Yes | ||
| 14 | PEX6 | 2100253 6660162 | 18452 | -0.871 | -0.6382 | Yes | ||
| 15 | TBRG1 | 6110678 6520181 | 18602 | -3.321 | 0.0008 | Yes |