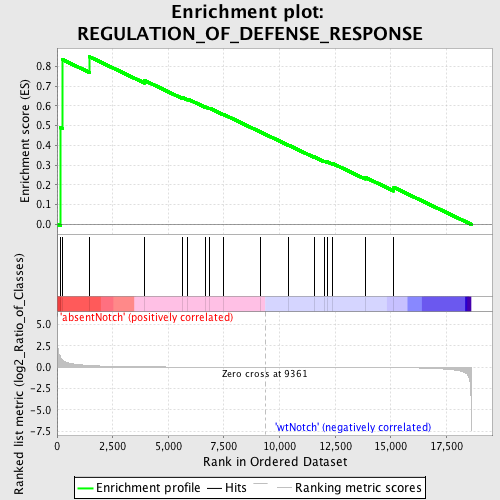
Profile of the Running ES Score & Positions of GeneSet Members on the Rank Ordered List
| Dataset | Set_03_absentNotch_versus_wtNotch.phenotype_absentNotch_versus_wtNotch.cls #absentNotch_versus_wtNotch.phenotype_absentNotch_versus_wtNotch.cls #absentNotch_versus_wtNotch_repos |
| Phenotype | phenotype_absentNotch_versus_wtNotch.cls#absentNotch_versus_wtNotch_repos |
| Upregulated in class | absentNotch |
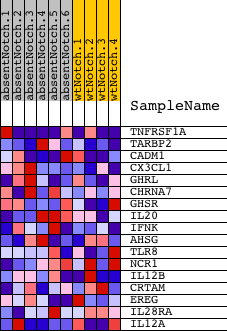
| GeneSet | REGULATION_OF_DEFENSE_RESPONSE |
| Enrichment Score (ES) | 0.84741914 |
| Normalized Enrichment Score (NES) | 1.5163511 |
| Nominal p-value | 0.017307693 |
| FDR q-value | 1.0 |
| FWER p-Value | 1.0 |
| PROBE | DESCRIPTION (from dataset) | GENE SYMBOL | GENE_TITLE | RANK IN GENE LIST | RANK METRIC SCORE | RUNNING ES | CORE ENRICHMENT | |
|---|---|---|---|---|---|---|---|---|
| 1 | TNFRSF1A | 1090390 6520735 | 146 | 1.196 | 0.4890 | Yes | ||
| 2 | TARBP2 | 60369 380026 4760377 | 236 | 0.841 | 0.8338 | Yes | ||
| 3 | CADM1 | 6620128 | 1462 | 0.191 | 0.8474 | Yes | ||
| 4 | CX3CL1 | 3990707 | 3929 | 0.032 | 0.7281 | No | ||
| 5 | GHRL | 2360619 6760438 | 5640 | 0.013 | 0.6416 | No | ||
| 6 | CHRNA7 | 2970446 | 5873 | 0.012 | 0.6340 | No | ||
| 7 | GHSR | 1980465 7050521 | 6679 | 0.008 | 0.5941 | No | ||
| 8 | IL20 | 4850647 | 6841 | 0.007 | 0.5885 | No | ||
| 9 | IFNK | 5690064 | 7463 | 0.005 | 0.5573 | No | ||
| 10 | AHSG | 6450014 | 9157 | 0.001 | 0.4665 | No | ||
| 11 | TLR8 | 1240092 | 10415 | -0.003 | 0.4001 | No | ||
| 12 | NCR1 | 2450026 | 11547 | -0.006 | 0.3419 | No | ||
| 13 | IL12B | 460008 | 12024 | -0.008 | 0.3197 | No | ||
| 14 | CRTAM | 4480110 | 12153 | -0.009 | 0.3164 | No | ||
| 15 | EREG | 50519 4920129 | 12398 | -0.010 | 0.3074 | No | ||
| 16 | IL28RA | 3710072 4920242 | 13847 | -0.021 | 0.2381 | No | ||
| 17 | IL12A | 7100551 | 15136 | -0.044 | 0.1871 | No |