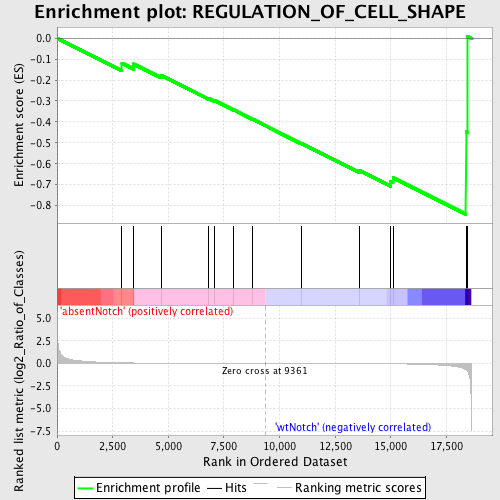
Profile of the Running ES Score & Positions of GeneSet Members on the Rank Ordered List
| Dataset | Set_03_absentNotch_versus_wtNotch.phenotype_absentNotch_versus_wtNotch.cls #absentNotch_versus_wtNotch.phenotype_absentNotch_versus_wtNotch.cls #absentNotch_versus_wtNotch_repos |
| Phenotype | phenotype_absentNotch_versus_wtNotch.cls#absentNotch_versus_wtNotch_repos |
| Upregulated in class | wtNotch |
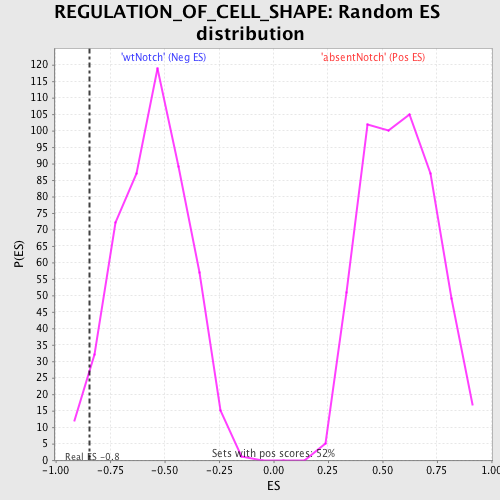
| GeneSet | REGULATION_OF_CELL_SHAPE |
| Enrichment Score (ES) | -0.84252614 |
| Normalized Enrichment Score (NES) | -1.5130475 |
| Nominal p-value | 0.035123967 |
| FDR q-value | 1.0 |
| FWER p-Value | 1.0 |
| PROBE | DESCRIPTION (from dataset) | GENE SYMBOL | GENE_TITLE | RANK IN GENE LIST | RANK METRIC SCORE | RUNNING ES | CORE ENRICHMENT | |
|---|---|---|---|---|---|---|---|---|
| 1 | CDC42EP2 | 540079 2970138 | 2914 | 0.064 | -0.1199 | No | ||
| 2 | FGD2 | 5340195 | 3442 | 0.044 | -0.1232 | No | ||
| 3 | CENTD2 | 60408 2510156 6100494 | 4680 | 0.021 | -0.1778 | No | ||
| 4 | TAOK2 | 110575 6380692 | 6799 | 0.008 | -0.2873 | No | ||
| 5 | FGD1 | 4780021 | 7066 | 0.006 | -0.2979 | No | ||
| 6 | CDC42EP1 | 6550279 6370215 4060450 4590066 | 7944 | 0.004 | -0.3428 | No | ||
| 7 | FGD5 | 3520438 4060500 | 8797 | 0.001 | -0.3878 | No | ||
| 8 | FGD4 | 520168 870411 2640253 6550338 6650364 | 10985 | -0.005 | -0.5028 | No | ||
| 9 | CDC42EP5 | 6400397 | 13601 | -0.018 | -0.6331 | No | ||
| 10 | FGD3 | 5690465 | 14985 | -0.040 | -0.6846 | Yes | ||
| 11 | FGD6 | 610632 | 15098 | -0.043 | -0.6662 | Yes | ||
| 12 | CDC42EP4 | 4150338 | 18379 | -0.692 | -0.4470 | Yes | ||
| 13 | MYH9 | 3120091 4850292 | 18433 | -0.804 | 0.0098 | Yes |