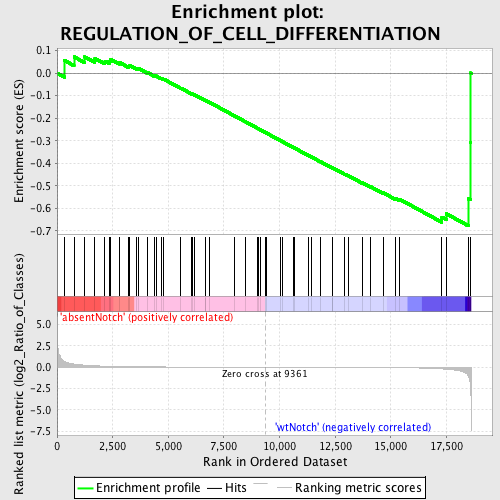
Profile of the Running ES Score & Positions of GeneSet Members on the Rank Ordered List
| Dataset | Set_03_absentNotch_versus_wtNotch.phenotype_absentNotch_versus_wtNotch.cls #absentNotch_versus_wtNotch.phenotype_absentNotch_versus_wtNotch.cls #absentNotch_versus_wtNotch_repos |
| Phenotype | phenotype_absentNotch_versus_wtNotch.cls#absentNotch_versus_wtNotch_repos |
| Upregulated in class | wtNotch |
| GeneSet | REGULATION_OF_CELL_DIFFERENTIATION |
| Enrichment Score (ES) | -0.67864096 |
| Normalized Enrichment Score (NES) | -1.4725399 |
| Nominal p-value | 0.03655914 |
| FDR q-value | 1.0 |
| FWER p-Value | 1.0 |
| PROBE | DESCRIPTION (from dataset) | GENE SYMBOL | GENE_TITLE | RANK IN GENE LIST | RANK METRIC SCORE | RUNNING ES | CORE ENRICHMENT | |
|---|---|---|---|---|---|---|---|---|
| 1 | BTG1 | 4200735 6040131 6200133 | 327 | 0.674 | 0.0567 | No | ||
| 2 | PF4 | 6130332 | 762 | 0.356 | 0.0726 | No | ||
| 3 | NME2 | 2190672 | 1243 | 0.233 | 0.0723 | No | ||
| 4 | SART1 | 5700113 | 1699 | 0.158 | 0.0652 | No | ||
| 5 | CDK6 | 4920253 | 2151 | 0.113 | 0.0533 | No | ||
| 6 | ZBTB16 | 3290022 | 2342 | 0.098 | 0.0539 | No | ||
| 7 | LDB1 | 5270601 | 2393 | 0.095 | 0.0617 | No | ||
| 8 | RUNX1 | 3840711 | 2788 | 0.071 | 0.0483 | No | ||
| 9 | PPARG | 1990168 2680603 6130632 | 3229 | 0.051 | 0.0302 | No | ||
| 10 | TWIST2 | 6760433 | 3268 | 0.050 | 0.0336 | No | ||
| 11 | TBX3 | 2570672 | 3581 | 0.040 | 0.0212 | No | ||
| 12 | ETS1 | 5270278 6450717 6620465 | 3678 | 0.037 | 0.0202 | No | ||
| 13 | YWHAH | 1660133 2810053 | 4048 | 0.030 | 0.0036 | No | ||
| 14 | NPHP3 | 2450497 7050731 | 4363 | 0.025 | -0.0106 | No | ||
| 15 | ACVR1B | 3610446 5570195 | 4444 | 0.024 | -0.0123 | No | ||
| 16 | TBX5 | 2900132 6370484 | 4687 | 0.021 | -0.0230 | No | ||
| 17 | TGFB2 | 4920292 | 4792 | 0.020 | -0.0264 | No | ||
| 18 | CALCA | 5860167 | 5551 | 0.014 | -0.0658 | No | ||
| 19 | BMPR1B | 4560010 4760121 6450161 | 6062 | 0.011 | -0.0921 | No | ||
| 20 | SNF1LK | 6110403 | 6102 | 0.011 | -0.0930 | No | ||
| 21 | FOXO3 | 2510484 4480451 | 6196 | 0.010 | -0.0969 | No | ||
| 22 | SHH | 5570400 | 6670 | 0.008 | -0.1215 | No | ||
| 23 | TCFL5 | 2190019 | 6686 | 0.008 | -0.1214 | No | ||
| 24 | IL20 | 4850647 | 6841 | 0.007 | -0.1289 | No | ||
| 25 | IL27 | 1990324 | 7979 | 0.004 | -0.1898 | No | ||
| 26 | NANOG | 2230152 3140114 4730632 | 8446 | 0.002 | -0.2146 | No | ||
| 27 | NLGN1 | 5670278 | 8990 | 0.001 | -0.2437 | No | ||
| 28 | SPINK5 | 5900010 | 9038 | 0.001 | -0.2462 | No | ||
| 29 | IL7 | 5360440 | 9156 | 0.001 | -0.2524 | No | ||
| 30 | NF1 | 6980433 | 9364 | -0.000 | -0.2636 | No | ||
| 31 | IGFBP3 | 2370500 | 9391 | -0.000 | -0.2650 | No | ||
| 32 | ACVR2A | 6110647 | 10039 | -0.002 | -0.2996 | No | ||
| 33 | CARTPT | 6660687 | 10152 | -0.002 | -0.3054 | No | ||
| 34 | SCIN | 5420180 | 10618 | -0.003 | -0.3301 | No | ||
| 35 | BOC | 5270348 | 10688 | -0.004 | -0.3334 | No | ||
| 36 | MAFB | 1230471 | 11277 | -0.005 | -0.3645 | No | ||
| 37 | IL4 | 6020537 | 11441 | -0.006 | -0.3726 | No | ||
| 38 | GPR98 | 6400647 | 11850 | -0.007 | -0.3938 | No | ||
| 39 | CNTN4 | 1780300 5570577 6370019 | 12371 | -0.010 | -0.4207 | No | ||
| 40 | EREG | 50519 4920129 | 12398 | -0.010 | -0.4210 | No | ||
| 41 | BMP4 | 380113 | 12935 | -0.013 | -0.4485 | No | ||
| 42 | NOTCH2 | 2570397 | 13080 | -0.014 | -0.4547 | No | ||
| 43 | SOCS5 | 3830398 7100093 | 13714 | -0.019 | -0.4867 | No | ||
| 44 | INHA | 6100102 | 14102 | -0.024 | -0.5050 | No | ||
| 45 | SPI1 | 1410397 | 14652 | -0.032 | -0.5310 | No | ||
| 46 | NOTCH4 | 2450040 6370707 | 15203 | -0.046 | -0.5555 | No | ||
| 47 | MAP4K1 | 4060692 | 15404 | -0.053 | -0.5605 | No | ||
| 48 | YWHAG | 3780341 | 17293 | -0.202 | -0.6399 | Yes | ||
| 49 | ZAP70 | 1410494 2260504 | 17495 | -0.237 | -0.6246 | Yes | ||
| 50 | ACIN1 | 3390278 6350377 6620142 | 18499 | -1.092 | -0.5584 | Yes | ||
| 51 | NOTCH1 | 3390114 | 18588 | -2.330 | -0.3064 | Yes | ||
| 52 | DTX1 | 5900372 | 18597 | -2.793 | 0.0010 | Yes |

