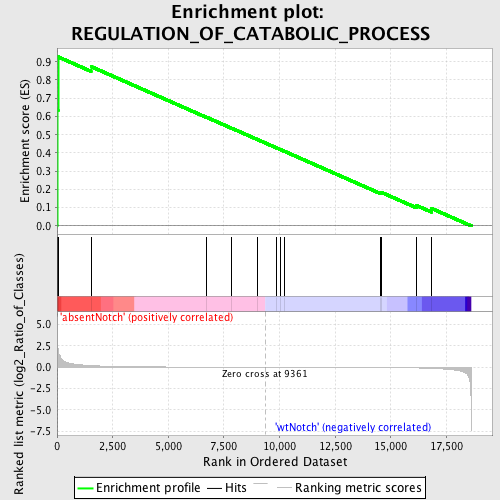
Profile of the Running ES Score & Positions of GeneSet Members on the Rank Ordered List
| Dataset | Set_03_absentNotch_versus_wtNotch.phenotype_absentNotch_versus_wtNotch.cls #absentNotch_versus_wtNotch.phenotype_absentNotch_versus_wtNotch.cls #absentNotch_versus_wtNotch_repos |
| Phenotype | phenotype_absentNotch_versus_wtNotch.cls#absentNotch_versus_wtNotch_repos |
| Upregulated in class | absentNotch |
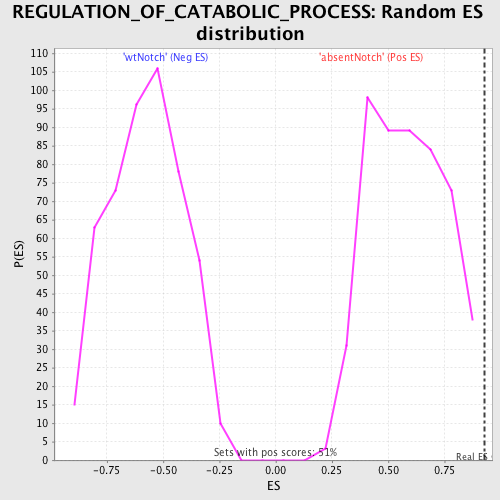
| GeneSet | REGULATION_OF_CATABOLIC_PROCESS |
| Enrichment Score (ES) | 0.92685395 |
| Normalized Enrichment Score (NES) | 1.5827683 |
| Nominal p-value | 0.0 |
| FDR q-value | 1.0 |
| FWER p-Value | 0.958 |
| PROBE | DESCRIPTION (from dataset) | GENE SYMBOL | GENE_TITLE | RANK IN GENE LIST | RANK METRIC SCORE | RUNNING ES | CORE ENRICHMENT | |
|---|---|---|---|---|---|---|---|---|
| 1 | FAF1 | 2450717 2510121 4730156 | 2 | 4.393 | 0.6370 | Yes | ||
| 2 | MDM2 | 3450053 5080138 | 44 | 2.014 | 0.9269 | Yes | ||
| 3 | STUB1 | 5860086 | 1526 | 0.182 | 0.8736 | No | ||
| 4 | PFKL | 6200167 | 6723 | 0.008 | 0.5954 | No | ||
| 5 | CIDEA | 4560020 | 7827 | 0.004 | 0.5367 | No | ||
| 6 | PPARA | 2060026 | 9022 | 0.001 | 0.4727 | No | ||
| 7 | APOA5 | 6130471 | 9858 | -0.001 | 0.4280 | No | ||
| 8 | ANGPTL3 | 6180497 | 10019 | -0.002 | 0.4196 | No | ||
| 9 | GAPDHS | 2690463 | 10198 | -0.002 | 0.4104 | No | ||
| 10 | EGLN2 | 540086 | 14538 | -0.030 | 0.1815 | No | ||
| 11 | MDM4 | 4070504 4780008 | 14602 | -0.031 | 0.1827 | No | ||
| 12 | HGS | 5570722 | 16164 | -0.089 | 0.1117 | No | ||
| 13 | PFKM | 1990156 5720168 | 16826 | -0.138 | 0.0962 | No |