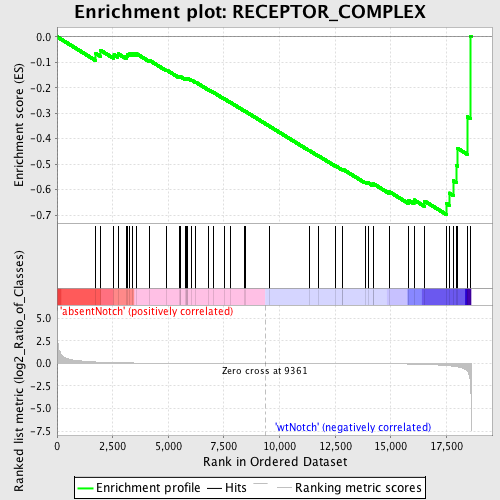
Profile of the Running ES Score & Positions of GeneSet Members on the Rank Ordered List
| Dataset | Set_03_absentNotch_versus_wtNotch.phenotype_absentNotch_versus_wtNotch.cls #absentNotch_versus_wtNotch.phenotype_absentNotch_versus_wtNotch.cls #absentNotch_versus_wtNotch_repos |
| Phenotype | phenotype_absentNotch_versus_wtNotch.cls#absentNotch_versus_wtNotch_repos |
| Upregulated in class | wtNotch |
| GeneSet | RECEPTOR_COMPLEX |
| Enrichment Score (ES) | -0.6973427 |
| Normalized Enrichment Score (NES) | -1.497398 |
| Nominal p-value | 0.018691588 |
| FDR q-value | 1.0 |
| FWER p-Value | 1.0 |
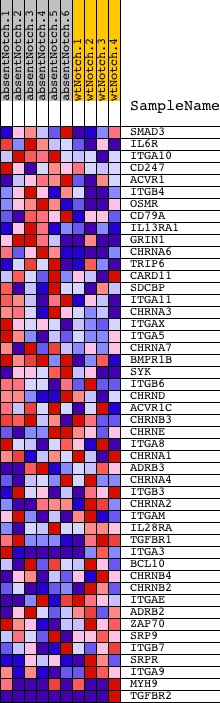
| PROBE | DESCRIPTION (from dataset) | GENE SYMBOL | GENE_TITLE | RANK IN GENE LIST | RANK METRIC SCORE | RUNNING ES | CORE ENRICHMENT | |
|---|---|---|---|---|---|---|---|---|
| 1 | SMAD3 | 6450671 | 1739 | 0.154 | -0.0656 | No | ||
| 2 | IL6R | 520706 3800215 | 1947 | 0.130 | -0.0529 | No | ||
| 3 | ITGA10 | 6330438 | 2556 | 0.084 | -0.0703 | No | ||
| 4 | CD247 | 3800725 5720136 | 2736 | 0.074 | -0.0664 | No | ||
| 5 | ACVR1 | 6840671 | 3108 | 0.056 | -0.0762 | No | ||
| 6 | ITGB4 | 1740021 3840482 | 3160 | 0.054 | -0.0692 | No | ||
| 7 | OSMR | 1990519 | 3270 | 0.049 | -0.0660 | No | ||
| 8 | CD79A | 3450563 | 3401 | 0.045 | -0.0648 | No | ||
| 9 | IL13RA1 | 5550609 | 3571 | 0.040 | -0.0665 | No | ||
| 10 | GRIN1 | 3800014 7000609 | 4163 | 0.028 | -0.0933 | No | ||
| 11 | CHRNA6 | 5340092 | 4919 | 0.018 | -0.1305 | No | ||
| 12 | TRIP6 | 6520609 | 5485 | 0.014 | -0.1584 | No | ||
| 13 | CARD11 | 70338 | 5527 | 0.014 | -0.1581 | No | ||
| 14 | SDCBP | 460487 2190039 5270441 | 5553 | 0.014 | -0.1569 | No | ||
| 15 | ITGA11 | 1740112 6590110 | 5751 | 0.012 | -0.1653 | No | ||
| 16 | CHRNA3 | 6760100 | 5805 | 0.012 | -0.1659 | No | ||
| 17 | ITGAX | 6130524 | 5807 | 0.012 | -0.1637 | No | ||
| 18 | ITGA5 | 5550520 | 5859 | 0.012 | -0.1643 | No | ||
| 19 | CHRNA7 | 2970446 | 5873 | 0.012 | -0.1628 | No | ||
| 20 | BMPR1B | 4560010 4760121 6450161 | 6062 | 0.011 | -0.1710 | No | ||
| 21 | SYK | 6940133 | 6233 | 0.010 | -0.1783 | No | ||
| 22 | ITGB6 | 2810068 4570332 | 6815 | 0.007 | -0.2082 | No | ||
| 23 | CHRND | 840403 2260670 | 7045 | 0.007 | -0.2194 | No | ||
| 24 | ACVR1C | 5890044 | 7503 | 0.005 | -0.2431 | No | ||
| 25 | CHRNB3 | 430441 870725 5720204 | 7808 | 0.004 | -0.2587 | No | ||
| 26 | CHRNE | 3190170 | 8421 | 0.003 | -0.2912 | No | ||
| 27 | ITGA8 | 4050086 | 8487 | 0.002 | -0.2942 | No | ||
| 28 | CHRNA1 | 1170025 3610364 5220292 | 9556 | -0.001 | -0.3517 | No | ||
| 29 | ADRB3 | 6900072 | 11337 | -0.006 | -0.4465 | No | ||
| 30 | CHRNA4 | 730075 2680091 | 11768 | -0.007 | -0.4683 | No | ||
| 31 | ITGB3 | 5270463 | 12509 | -0.010 | -0.5063 | No | ||
| 32 | CHRNA2 | 5050315 | 12820 | -0.012 | -0.5208 | No | ||
| 33 | ITGAM | 1190373 | 12840 | -0.012 | -0.5196 | No | ||
| 34 | IL28RA | 3710072 4920242 | 13847 | -0.021 | -0.5700 | No | ||
| 35 | TGFBR1 | 1400148 4280020 6550711 | 13974 | -0.022 | -0.5728 | No | ||
| 36 | ITGA3 | 4570427 | 14206 | -0.025 | -0.5806 | No | ||
| 37 | BCL10 | 2360397 | 14211 | -0.025 | -0.5763 | No | ||
| 38 | CHRNB4 | 6370110 | 14938 | -0.039 | -0.6083 | No | ||
| 39 | CHRNB2 | 580204 3120739 | 15798 | -0.069 | -0.6420 | No | ||
| 40 | ITGAE | 4210632 4670239 5340253 5420746 5690154 5700685 6770154 | 16044 | -0.082 | -0.6402 | No | ||
| 41 | ADRB2 | 3290373 | 16519 | -0.114 | -0.6448 | No | ||
| 42 | ZAP70 | 1410494 2260504 | 17495 | -0.237 | -0.6540 | Yes | ||
| 43 | SRP9 | 3170053 4540538 | 17624 | -0.262 | -0.6130 | Yes | ||
| 44 | ITGB7 | 4670619 | 17815 | -0.318 | -0.5651 | Yes | ||
| 45 | SRPR | 6590647 6370114 | 17959 | -0.367 | -0.5058 | Yes | ||
| 46 | ITGA9 | 670180 | 18005 | -0.385 | -0.4379 | Yes | ||
| 47 | MYH9 | 3120091 4850292 | 18433 | -0.804 | -0.3138 | Yes | ||
| 48 | TGFBR2 | 1780711 1980537 6550398 | 18569 | -1.770 | 0.0025 | Yes |