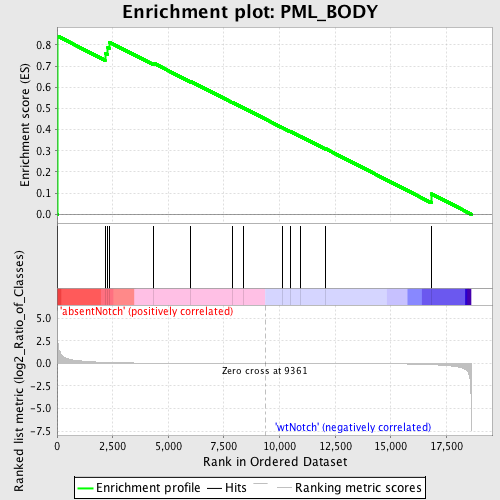
Profile of the Running ES Score & Positions of GeneSet Members on the Rank Ordered List
| Dataset | Set_03_absentNotch_versus_wtNotch.phenotype_absentNotch_versus_wtNotch.cls #absentNotch_versus_wtNotch.phenotype_absentNotch_versus_wtNotch.cls #absentNotch_versus_wtNotch_repos |
| Phenotype | phenotype_absentNotch_versus_wtNotch.cls#absentNotch_versus_wtNotch_repos |
| Upregulated in class | absentNotch |
| GeneSet | PML_BODY |
| Enrichment Score (ES) | 0.84154356 |
| Normalized Enrichment Score (NES) | 1.4724782 |
| Nominal p-value | 0.025925925 |
| FDR q-value | 0.98992 |
| FWER p-Value | 1.0 |
| PROBE | DESCRIPTION (from dataset) | GENE SYMBOL | GENE_TITLE | RANK IN GENE LIST | RANK METRIC SCORE | RUNNING ES | CORE ENRICHMENT | |
|---|---|---|---|---|---|---|---|---|
| 1 | SFRS2 | 50707 380593 | 22 | 2.749 | 0.8415 | Yes | ||
| 2 | RPA1 | 360452 | 2158 | 0.112 | 0.7612 | No | ||
| 3 | RB1 | 5900338 | 2280 | 0.103 | 0.7864 | No | ||
| 4 | ZBTB16 | 3290022 | 2342 | 0.098 | 0.8132 | No | ||
| 5 | ISG20 | 1770750 | 4339 | 0.025 | 0.7137 | No | ||
| 6 | SPTBN4 | 4150279 5270286 | 6007 | 0.011 | 0.6274 | No | ||
| 7 | LRCH4 | 5220279 6510026 | 7875 | 0.004 | 0.5283 | No | ||
| 8 | CHEK2 | 610139 1050022 | 8379 | 0.003 | 0.5021 | No | ||
| 9 | UBE2I | 2680056 6350446 | 10117 | -0.002 | 0.4093 | No | ||
| 10 | SP100 | 3440632 | 10501 | -0.003 | 0.3897 | No | ||
| 11 | PML | 50093 2190435 2450402 3840082 | 10952 | -0.004 | 0.3668 | No | ||
| 12 | TOPBP1 | 6020333 | 12057 | -0.008 | 0.3100 | No | ||
| 13 | ELF4 | 4850193 | 16830 | -0.139 | 0.0960 | No |

