Profile of the Running ES Score & Positions of GeneSet Members on the Rank Ordered List
| Dataset | Set_03_absentNotch_versus_wtNotch.phenotype_absentNotch_versus_wtNotch.cls #absentNotch_versus_wtNotch.phenotype_absentNotch_versus_wtNotch.cls #absentNotch_versus_wtNotch_repos |
| Phenotype | phenotype_absentNotch_versus_wtNotch.cls#absentNotch_versus_wtNotch_repos |
| Upregulated in class | absentNotch |
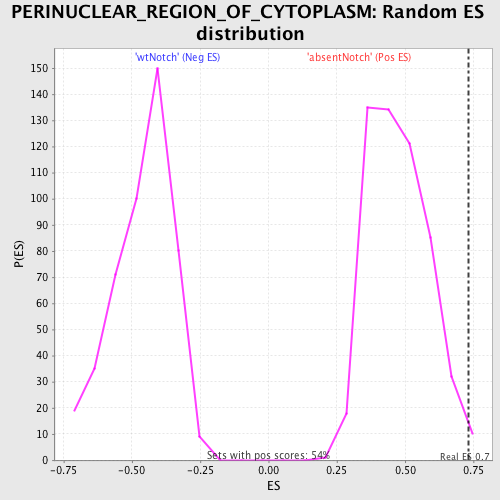
| GeneSet | PERINUCLEAR_REGION_OF_CYTOPLASM |
| Enrichment Score (ES) | 0.73129714 |
| Normalized Enrichment Score (NES) | 1.5415753 |
| Nominal p-value | 0.009328358 |
| FDR q-value | 1.0 |
| FWER p-Value | 1.0 |
| PROBE | DESCRIPTION (from dataset) | GENE SYMBOL | GENE_TITLE | RANK IN GENE LIST | RANK METRIC SCORE | RUNNING ES | CORE ENRICHMENT | |
|---|---|---|---|---|---|---|---|---|
| 1 | FAF1 | 2450717 2510121 4730156 | 2 | 4.393 | 0.3778 | Yes | ||
| 2 | PICK1 | 3990500 4920500 | 153 | 1.158 | 0.4693 | Yes | ||
| 3 | APEX1 | 3190519 | 459 | 0.538 | 0.4992 | Yes | ||
| 4 | STX6 | 4850750 6770278 | 527 | 0.480 | 0.5368 | Yes | ||
| 5 | MYO9B | 1230435 3060358 | 616 | 0.421 | 0.5683 | Yes | ||
| 6 | CYFIP1 | 5690082 | 621 | 0.416 | 0.6039 | Yes | ||
| 7 | YWHAB | 1740176 | 642 | 0.407 | 0.6378 | Yes | ||
| 8 | RAB14 | 6860139 | 757 | 0.357 | 0.6624 | Yes | ||
| 9 | MAGEE1 | 1660138 | 761 | 0.356 | 0.6929 | Yes | ||
| 10 | TAF10 | 2760020 | 1068 | 0.269 | 0.6995 | Yes | ||
| 11 | ACTN4 | 3840301 4590390 7050132 | 1168 | 0.246 | 0.7154 | Yes | ||
| 12 | MYO6 | 2190332 | 1504 | 0.186 | 0.7133 | Yes | ||
| 13 | VAPA | 2480594 | 1648 | 0.164 | 0.7197 | Yes | ||
| 14 | ANP32A | 510044 1580095 2680037 | 1687 | 0.159 | 0.7313 | Yes | ||
| 15 | CDH1 | 1940736 | 2341 | 0.098 | 0.7046 | No | ||
| 16 | TLR4 | 1690167 2650369 3850333 | 3003 | 0.061 | 0.6742 | No | ||
| 17 | TPD52L1 | 4590711 5570575 | 3616 | 0.039 | 0.6446 | No | ||
| 18 | DYNC1I1 | 1410605 | 4057 | 0.030 | 0.6235 | No | ||
| 19 | ATXN2 | 3940017 4810242 | 4456 | 0.024 | 0.6041 | No | ||
| 20 | TYR | 5690139 | 6251 | 0.010 | 0.5083 | No | ||
| 21 | CAV2 | 5130286 5130563 | 6288 | 0.010 | 0.5072 | No | ||
| 22 | ACHE | 5290750 | 6411 | 0.009 | 0.5014 | No | ||
| 23 | SET | 6650286 | 6653 | 0.008 | 0.4892 | No | ||
| 24 | SLC2A4 | 540441 | 7754 | 0.004 | 0.4303 | No | ||
| 25 | TPD52 | 670463 4610541 | 7810 | 0.004 | 0.4277 | No | ||
| 26 | TNFSF12 | 1940465 | 7939 | 0.004 | 0.4211 | No | ||
| 27 | SPINK5 | 5900010 | 9038 | 0.001 | 0.3621 | No | ||
| 28 | CHODL | 7050039 | 9382 | -0.000 | 0.3436 | No | ||
| 29 | HMGB2 | 2640603 | 10432 | -0.003 | 0.2874 | No | ||
| 30 | KIF5B | 770397 5420168 | 10698 | -0.004 | 0.2734 | No | ||
| 31 | PARK2 | 2030053 2030452 3520594 4200136 | 11219 | -0.005 | 0.2458 | No | ||
| 32 | DNAJB6 | 2810309 5570451 | 11812 | -0.007 | 0.2146 | No | ||
| 33 | NF2 | 4150735 6450139 | 12001 | -0.008 | 0.2052 | No | ||
| 34 | ATP7A | 6550168 | 13055 | -0.014 | 0.1496 | No | ||
| 35 | DCTN3 | 6840131 | 13072 | -0.014 | 0.1499 | No | ||
| 36 | CYFIP2 | 520577 6040300 | 13214 | -0.015 | 0.1436 | No | ||
| 37 | ATP7B | 2060711 2470039 3140301 6650735 | 14105 | -0.024 | 0.0977 | No | ||
| 38 | BCL10 | 2360397 | 14211 | -0.025 | 0.0942 | No | ||
| 39 | NPC1 | 4590020 | 14281 | -0.026 | 0.0927 | No | ||
| 40 | MAP1S | 1980463 | 15163 | -0.045 | 0.0492 | No | ||
| 41 | SEPT9 | 1940040 | 15576 | -0.059 | 0.0321 | No | ||
| 42 | LRPPRC | 2370072 2470408 | 15957 | -0.077 | 0.0182 | No | ||
| 43 | GTPBP4 | 6840332 | 16820 | -0.138 | -0.0163 | No | ||
| 44 | ZFYVE1 | 60440 | 17427 | -0.225 | -0.0296 | No | ||
| 45 | VPS4A | 6480475 | 17558 | -0.249 | -0.0152 | No | ||
| 46 | ATXN10 | 4230358 | 17591 | -0.256 | 0.0051 | No | ||
| 47 | HSP90B1 | 5670576 | 17616 | -0.261 | 0.0263 | No | ||
| 48 | CLN5 | 630767 | 17827 | -0.320 | 0.0425 | No |