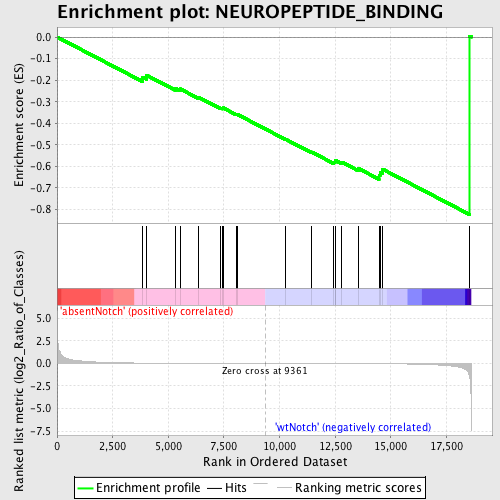
Profile of the Running ES Score & Positions of GeneSet Members on the Rank Ordered List
| Dataset | Set_03_absentNotch_versus_wtNotch.phenotype_absentNotch_versus_wtNotch.cls #absentNotch_versus_wtNotch.phenotype_absentNotch_versus_wtNotch.cls #absentNotch_versus_wtNotch_repos |
| Phenotype | phenotype_absentNotch_versus_wtNotch.cls#absentNotch_versus_wtNotch_repos |
| Upregulated in class | wtNotch |
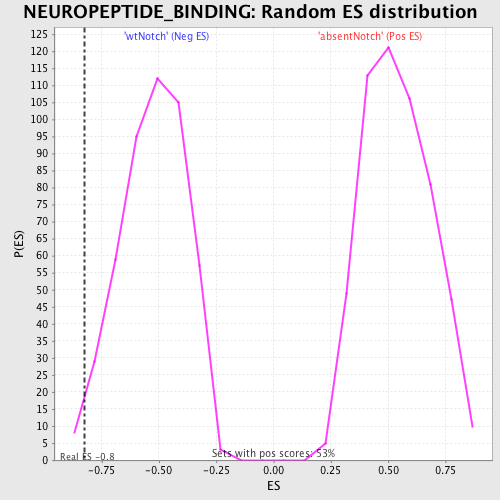
| GeneSet | NEUROPEPTIDE_BINDING |
| Enrichment Score (ES) | -0.8229202 |
| Normalized Enrichment Score (NES) | -1.5735533 |
| Nominal p-value | 0.017094018 |
| FDR q-value | 1.0 |
| FWER p-Value | 0.999 |
| PROBE | DESCRIPTION (from dataset) | GENE SYMBOL | GENE_TITLE | RANK IN GENE LIST | RANK METRIC SCORE | RUNNING ES | CORE ENRICHMENT | |
|---|---|---|---|---|---|---|---|---|
| 1 | NMUR2 | 1580717 | 3832 | 0.034 | -0.1854 | No | ||
| 2 | BRS3 | 1740403 | 4017 | 0.030 | -0.1769 | No | ||
| 3 | NPY6R | 4560136 | 5310 | 0.015 | -0.2371 | No | ||
| 4 | NMUR1 | 1500403 | 5531 | 0.014 | -0.2406 | No | ||
| 5 | GALR2 | 6450739 | 6370 | 0.009 | -0.2800 | No | ||
| 6 | NMBR | 6180315 | 7348 | 0.006 | -0.3292 | No | ||
| 7 | MC2R | 2970504 | 7434 | 0.005 | -0.3305 | No | ||
| 8 | CCKBR | 2760128 | 7456 | 0.005 | -0.3285 | No | ||
| 9 | TACR1 | 70358 3840411 | 8066 | 0.003 | -0.3591 | No | ||
| 10 | HCRTR2 | 2350463 | 8085 | 0.003 | -0.3580 | No | ||
| 11 | TACR2 | 1740358 | 10274 | -0.002 | -0.4742 | No | ||
| 12 | MCHR1 | 1780022 | 11437 | -0.006 | -0.5331 | No | ||
| 13 | SSTR3 | 5420064 | 12441 | -0.010 | -0.5810 | No | ||
| 14 | CCKAR | 4210079 | 12494 | -0.010 | -0.5775 | No | ||
| 15 | TACR3 | 4780017 | 12520 | -0.010 | -0.5725 | No | ||
| 16 | GALR1 | 6020452 | 12792 | -0.012 | -0.5799 | No | ||
| 17 | SSTR4 | 6100398 | 13552 | -0.018 | -0.6101 | No | ||
| 18 | GALR3 | 4850113 | 14471 | -0.029 | -0.6418 | Yes | ||
| 19 | KISS1R | 2480601 | 14519 | -0.030 | -0.6261 | Yes | ||
| 20 | SSTR1 | 2630471 | 14617 | -0.032 | -0.6122 | Yes | ||
| 21 | SSTR2 | 4590687 | 18537 | -1.366 | 0.0042 | Yes |