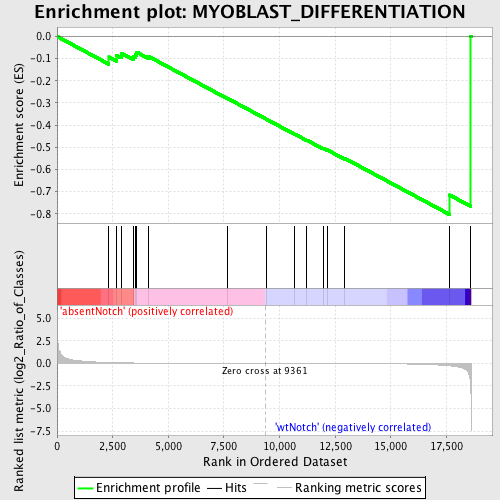
Profile of the Running ES Score & Positions of GeneSet Members on the Rank Ordered List
| Dataset | Set_03_absentNotch_versus_wtNotch.phenotype_absentNotch_versus_wtNotch.cls #absentNotch_versus_wtNotch.phenotype_absentNotch_versus_wtNotch.cls #absentNotch_versus_wtNotch_repos |
| Phenotype | phenotype_absentNotch_versus_wtNotch.cls#absentNotch_versus_wtNotch_repos |
| Upregulated in class | wtNotch |
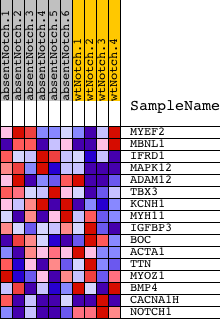
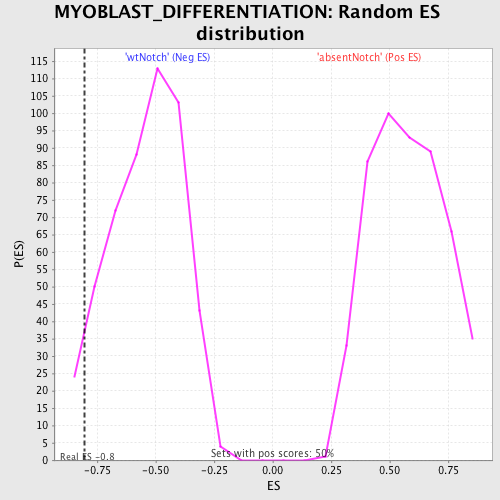
| GeneSet | MYOBLAST_DIFFERENTIATION |
| Enrichment Score (ES) | -0.80295205 |
| Normalized Enrichment Score (NES) | -1.4864618 |
| Nominal p-value | 0.04828974 |
| FDR q-value | 1.0 |
| FWER p-Value | 1.0 |
| PROBE | DESCRIPTION (from dataset) | GENE SYMBOL | GENE_TITLE | RANK IN GENE LIST | RANK METRIC SCORE | RUNNING ES | CORE ENRICHMENT | |
|---|---|---|---|---|---|---|---|---|
| 1 | MYEF2 | 6860484 | 2331 | 0.099 | -0.0926 | No | ||
| 2 | MBNL1 | 2640762 7100048 | 2676 | 0.077 | -0.0858 | No | ||
| 3 | IFRD1 | 4590215 | 2883 | 0.066 | -0.0751 | No | ||
| 4 | MAPK12 | 450022 1340717 7050484 | 3440 | 0.044 | -0.0906 | No | ||
| 5 | ADAM12 | 3390132 4070347 | 3526 | 0.042 | -0.0815 | No | ||
| 6 | TBX3 | 2570672 | 3581 | 0.040 | -0.0713 | No | ||
| 7 | KCNH1 | 4070619 6660181 | 4113 | 0.029 | -0.0903 | No | ||
| 8 | MYH11 | 7100273 | 7640 | 0.005 | -0.2783 | No | ||
| 9 | IGFBP3 | 2370500 | 9391 | -0.000 | -0.3724 | No | ||
| 10 | BOC | 5270348 | 10688 | -0.004 | -0.4409 | No | ||
| 11 | ACTA1 | 840538 | 11213 | -0.005 | -0.4673 | No | ||
| 12 | TTN | 2320161 4670056 6550026 | 11954 | -0.008 | -0.5045 | No | ||
| 13 | MYOZ1 | 2760670 | 12132 | -0.009 | -0.5112 | No | ||
| 14 | BMP4 | 380113 | 12935 | -0.013 | -0.5501 | No | ||
| 15 | CACNA1H | 1230279 | 17639 | -0.267 | -0.7150 | Yes | ||
| 16 | NOTCH1 | 3390114 | 18588 | -2.330 | 0.0015 | Yes |