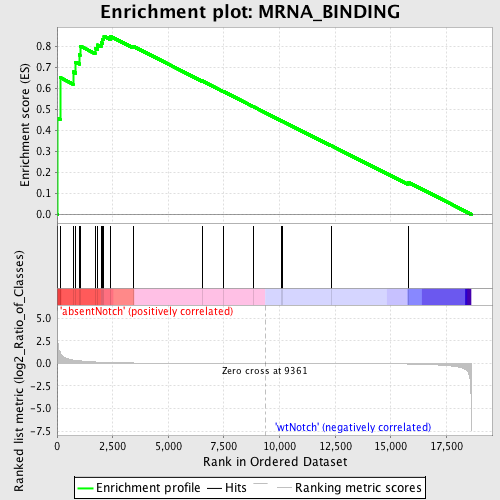
Profile of the Running ES Score & Positions of GeneSet Members on the Rank Ordered List
| Dataset | Set_03_absentNotch_versus_wtNotch.phenotype_absentNotch_versus_wtNotch.cls #absentNotch_versus_wtNotch.phenotype_absentNotch_versus_wtNotch.cls #absentNotch_versus_wtNotch_repos |
| Phenotype | phenotype_absentNotch_versus_wtNotch.cls#absentNotch_versus_wtNotch_repos |
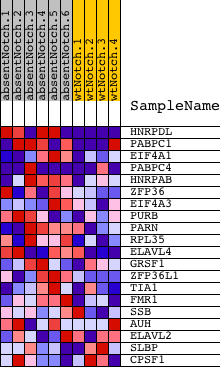
| Upregulated in class | absentNotch |
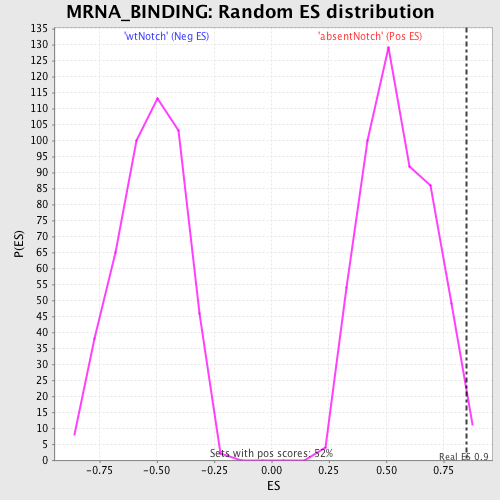
| GeneSet | MRNA_BINDING |
| Enrichment Score (ES) | 0.8504747 |
| Normalized Enrichment Score (NES) | 1.5454962 |
| Nominal p-value | 0.011428571 |
| FDR q-value | 1.0 |
| FWER p-Value | 1.0 |
| PROBE | DESCRIPTION (from dataset) | GENE SYMBOL | GENE_TITLE | RANK IN GENE LIST | RANK METRIC SCORE | RUNNING ES | CORE ENRICHMENT | |
|---|---|---|---|---|---|---|---|---|
| 1 | HNRPDL | 1050102 1090181 5360471 | 19 | 2.927 | 0.4590 | Yes | ||
| 2 | PABPC1 | 2650180 2690253 6020632 1990270 | 137 | 1.272 | 0.6526 | Yes | ||
| 3 | EIF4A1 | 1990341 2810300 | 721 | 0.371 | 0.6796 | Yes | ||
| 4 | PABPC4 | 1990170 6760270 5390138 | 833 | 0.332 | 0.7257 | Yes | ||
| 5 | HNRPAB | 540504 | 996 | 0.284 | 0.7617 | Yes | ||
| 6 | ZFP36 | 2030605 | 1033 | 0.277 | 0.8033 | Yes | ||
| 7 | EIF4A3 | 3440538 | 1709 | 0.157 | 0.7916 | Yes | ||
| 8 | PURB | 5360138 | 1821 | 0.144 | 0.8082 | Yes | ||
| 9 | PARN | 3840129 | 1979 | 0.127 | 0.8197 | Yes | ||
| 10 | RPL35 | 6940070 | 2049 | 0.121 | 0.8350 | Yes | ||
| 11 | ELAVL4 | 50735 3360086 5220167 | 2105 | 0.117 | 0.8505 | Yes | ||
| 12 | GRSF1 | 2100184 | 2402 | 0.094 | 0.8494 | No | ||
| 13 | ZFP36L1 | 2510138 4120048 | 3434 | 0.044 | 0.8008 | No | ||
| 14 | TIA1 | 4670373 | 6512 | 0.009 | 0.6367 | No | ||
| 15 | FMR1 | 5050075 | 7493 | 0.005 | 0.5848 | No | ||
| 16 | SSB | 460286 3140717 | 8819 | 0.001 | 0.5138 | No | ||
| 17 | AUH | 5570152 | 10091 | -0.002 | 0.4458 | No | ||
| 18 | ELAVL2 | 360181 | 10138 | -0.002 | 0.4436 | No | ||
| 19 | SLBP | 6220601 | 12314 | -0.009 | 0.3281 | No | ||
| 20 | CPSF1 | 6290064 | 15776 | -0.068 | 0.1527 | No |