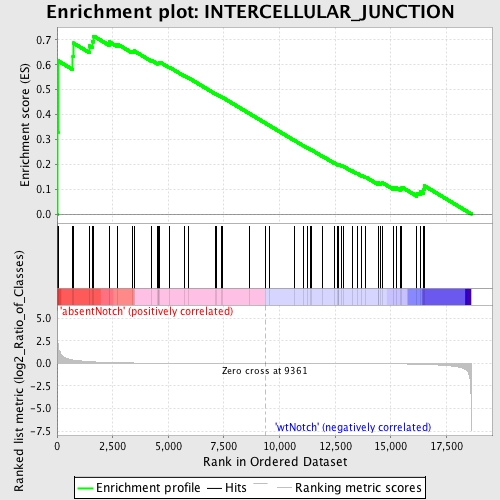
Profile of the Running ES Score & Positions of GeneSet Members on the Rank Ordered List
| Dataset | Set_03_absentNotch_versus_wtNotch.phenotype_absentNotch_versus_wtNotch.cls #absentNotch_versus_wtNotch.phenotype_absentNotch_versus_wtNotch.cls #absentNotch_versus_wtNotch_repos |
| Phenotype | phenotype_absentNotch_versus_wtNotch.cls#absentNotch_versus_wtNotch_repos |
| Upregulated in class | absentNotch |
| GeneSet | INTERCELLULAR_JUNCTION |
| Enrichment Score (ES) | 0.71531993 |
| Normalized Enrichment Score (NES) | 1.5258226 |
| Nominal p-value | 0.012345679 |
| FDR q-value | 1.0 |
| FWER p-Value | 1.0 |
| PROBE | DESCRIPTION (from dataset) | GENE SYMBOL | GENE_TITLE | RANK IN GENE LIST | RANK METRIC SCORE | RUNNING ES | CORE ENRICHMENT | |
|---|---|---|---|---|---|---|---|---|
| 1 | GJA1 | 5220731 | 34 | 2.268 | 0.3283 | Yes | ||
| 2 | CLDN4 | 4920739 | 45 | 1.980 | 0.6160 | Yes | ||
| 3 | PDZD3 | 630711 | 711 | 0.374 | 0.6346 | Yes | ||
| 4 | VCL | 4120487 | 724 | 0.370 | 0.6878 | Yes | ||
| 5 | CADM1 | 6620128 | 1462 | 0.191 | 0.6760 | Yes | ||
| 6 | CDC42BPB | 6350037 | 1577 | 0.175 | 0.6953 | Yes | ||
| 7 | VAPA | 2480594 | 1648 | 0.164 | 0.7153 | Yes | ||
| 8 | CDH1 | 1940736 | 2341 | 0.098 | 0.6924 | No | ||
| 9 | ASH1L | 2510402 5360687 6650685 | 2720 | 0.075 | 0.6829 | No | ||
| 10 | WNK4 | 1240682 | 3378 | 0.046 | 0.6541 | No | ||
| 11 | CLDN1 | 5670746 | 3463 | 0.043 | 0.6559 | No | ||
| 12 | PARD3 | 3390324 5390541 | 4237 | 0.027 | 0.6182 | No | ||
| 13 | CLDN23 | 4670538 | 4521 | 0.023 | 0.6062 | No | ||
| 14 | CNKSR1 | 730528 3390672 | 4570 | 0.022 | 0.6069 | No | ||
| 15 | CNN2 | 2230433 5270446 | 4577 | 0.022 | 0.6098 | No | ||
| 16 | GJB1 | 1240441 | 4621 | 0.022 | 0.6106 | No | ||
| 17 | CLDN15 | 4150270 4730592 | 5056 | 0.017 | 0.5897 | No | ||
| 18 | CDC42BPA | 840671 | 5709 | 0.013 | 0.5565 | No | ||
| 19 | CLDN14 | 5340292 | 5915 | 0.012 | 0.5471 | No | ||
| 20 | PGM5 | 2340446 | 7140 | 0.006 | 0.4821 | No | ||
| 21 | CLDN7 | 1190301 | 7164 | 0.006 | 0.4817 | No | ||
| 22 | PARD6B | 4120600 | 7394 | 0.005 | 0.4702 | No | ||
| 23 | CLDN2 | 580053 | 7436 | 0.005 | 0.4688 | No | ||
| 24 | DSC3 | 6840576 | 8665 | 0.002 | 0.4029 | No | ||
| 25 | PNN | 6650504 | 9383 | -0.000 | 0.3643 | No | ||
| 26 | CLDN3 | 2570524 | 9524 | -0.000 | 0.3568 | No | ||
| 27 | CLDN8 | 1770113 2320500 | 10670 | -0.004 | 0.2956 | No | ||
| 28 | TJP1 | 6350184 | 11055 | -0.005 | 0.2756 | No | ||
| 29 | CLDN11 | 670338 | 11266 | -0.005 | 0.2651 | No | ||
| 30 | CLDN10 | 4070364 4590059 4920097 5080687 6620270 | 11409 | -0.006 | 0.2583 | No | ||
| 31 | PDZD2 | 2360086 2650097 4120504 5390010 | 11414 | -0.006 | 0.2589 | No | ||
| 32 | NRAP | 1780433 | 11945 | -0.008 | 0.2315 | No | ||
| 33 | CLDN17 | 3710672 | 12452 | -0.010 | 0.2057 | No | ||
| 34 | CLDN9 | 840373 | 12618 | -0.011 | 0.1984 | No | ||
| 35 | GJA8 | 7000619 | 12649 | -0.011 | 0.1984 | No | ||
| 36 | RAB13 | 3710309 | 12655 | -0.011 | 0.1998 | No | ||
| 37 | CLDN16 | 1850286 | 12786 | -0.012 | 0.1945 | No | ||
| 38 | DSC1 | 6130400 | 12878 | -0.012 | 0.1914 | No | ||
| 39 | CDH24 | 6980592 | 13255 | -0.015 | 0.1733 | No | ||
| 40 | CADM3 | 6660072 | 13481 | -0.017 | 0.1637 | No | ||
| 41 | COL17A1 | 2030672 5130347 | 13692 | -0.019 | 0.1551 | No | ||
| 42 | BAI1 | 6350053 | 13878 | -0.021 | 0.1482 | No | ||
| 43 | CLDN19 | 2690184 6370240 | 14426 | -0.028 | 0.1229 | No | ||
| 44 | CLDN5 | 6510717 | 14441 | -0.028 | 0.1262 | No | ||
| 45 | CLDN12 | 6350341 | 14557 | -0.031 | 0.1245 | No | ||
| 46 | ZYX | 4730068 | 14621 | -0.032 | 0.1257 | No | ||
| 47 | STEAP1 | 4590575 | 15114 | -0.043 | 0.1055 | No | ||
| 48 | GJB2 | 5900609 6200487 | 15249 | -0.047 | 0.1052 | No | ||
| 49 | AMOTL1 | 380279 | 15420 | -0.054 | 0.1039 | No | ||
| 50 | DLG1 | 2630091 6020286 | 15497 | -0.057 | 0.1080 | No | ||
| 51 | CLDN18 | 2030193 | 16175 | -0.089 | 0.0845 | No | ||
| 52 | PKP4 | 3710400 5890097 | 16321 | -0.099 | 0.0911 | No | ||
| 53 | PARD6A | 4120170 | 16456 | -0.109 | 0.0998 | No | ||
| 54 | B4GALT1 | 6980167 | 16501 | -0.113 | 0.1139 | No |

