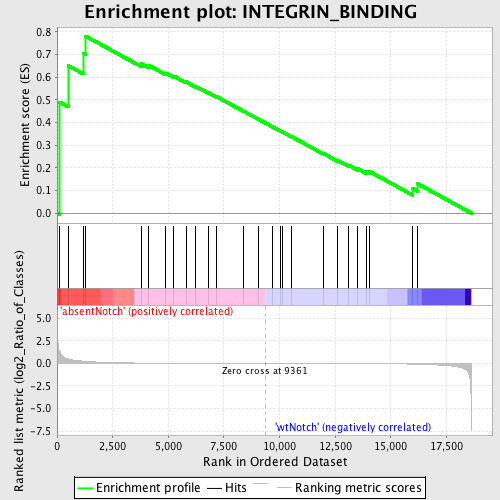
Profile of the Running ES Score & Positions of GeneSet Members on the Rank Ordered List
| Dataset | Set_03_absentNotch_versus_wtNotch.phenotype_absentNotch_versus_wtNotch.cls #absentNotch_versus_wtNotch.phenotype_absentNotch_versus_wtNotch.cls #absentNotch_versus_wtNotch_repos |
| Phenotype | phenotype_absentNotch_versus_wtNotch.cls#absentNotch_versus_wtNotch_repos |
| Upregulated in class | absentNotch |
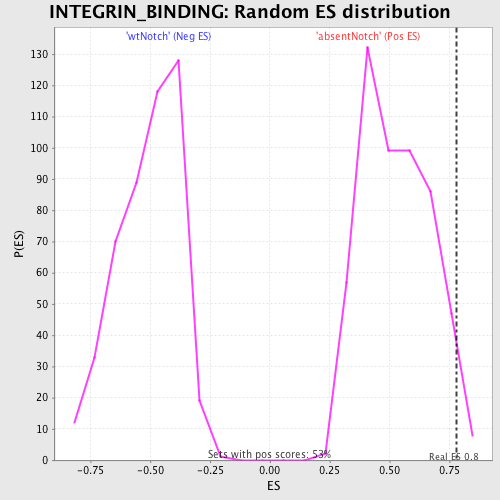
| GeneSet | INTEGRIN_BINDING |
| Enrichment Score (ES) | 0.78165126 |
| Normalized Enrichment Score (NES) | 1.482758 |
| Nominal p-value | 0.024528302 |
| FDR q-value | 0.9752236 |
| FWER p-Value | 1.0 |
| PROBE | DESCRIPTION (from dataset) | GENE SYMBOL | GENE_TITLE | RANK IN GENE LIST | RANK METRIC SCORE | RUNNING ES | CORE ENRICHMENT | |
|---|---|---|---|---|---|---|---|---|
| 1 | TGFBI | 2060446 6900112 | 113 | 1.357 | 0.4906 | Yes | ||
| 2 | ACTN2 | 4200435 | 500 | 0.495 | 0.6512 | Yes | ||
| 3 | ACTN4 | 3840301 4590390 7050132 | 1168 | 0.246 | 0.7054 | Yes | ||
| 4 | ICAM2 | 6400113 | 1280 | 0.225 | 0.7817 | Yes | ||
| 5 | ICAM4 | 6770053 | 3786 | 0.035 | 0.6599 | No | ||
| 6 | COL16A1 | 1780520 | 4126 | 0.029 | 0.6521 | No | ||
| 7 | THY1 | 5910162 | 4874 | 0.019 | 0.6188 | No | ||
| 8 | ACTN3 | 3140541 6480598 | 5251 | 0.016 | 0.6043 | No | ||
| 9 | ADAM23 | 460091 2450156 | 5794 | 0.012 | 0.5797 | No | ||
| 10 | SYK | 6940133 | 6233 | 0.010 | 0.5598 | No | ||
| 11 | EDIL3 | 1240039 | 6805 | 0.008 | 0.5318 | No | ||
| 12 | ECM2 | 1470561 | 7179 | 0.006 | 0.5140 | No | ||
| 13 | DMP1 | 4760398 | 8396 | 0.003 | 0.4495 | No | ||
| 14 | ADAM2 | 670121 | 9037 | 0.001 | 0.4154 | No | ||
| 15 | ADAMTS5 | 5890592 | 9680 | -0.001 | 0.3811 | No | ||
| 16 | ANGPTL3 | 6180497 | 10019 | -0.002 | 0.3636 | No | ||
| 17 | DST | 430026 1090035 2340577 3170068 3870112 4780519 6400167 6450358 7040347 | 10116 | -0.002 | 0.3591 | No | ||
| 18 | ADAM9 | 3360411 | 10538 | -0.003 | 0.3376 | No | ||
| 19 | FBLN5 | 6550010 | 11951 | -0.008 | 0.2646 | No | ||
| 20 | EGFL6 | 3940181 | 12614 | -0.011 | 0.2330 | No | ||
| 21 | ADAMTS8 | 3990497 | 13118 | -0.014 | 0.2111 | No | ||
| 22 | VWF | 4670519 | 13513 | -0.017 | 0.1962 | No | ||
| 23 | TNXB | 630592 3830020 5360497 7000673 | 13902 | -0.021 | 0.1830 | No | ||
| 24 | COL4A3 | 5910075 | 14021 | -0.023 | 0.1849 | No | ||
| 25 | ERBB2IP | 580253 1090672 | 15991 | -0.079 | 0.1078 | No | ||
| 26 | ADAM11 | 1050008 3130494 | 16214 | -0.091 | 0.1292 | No |