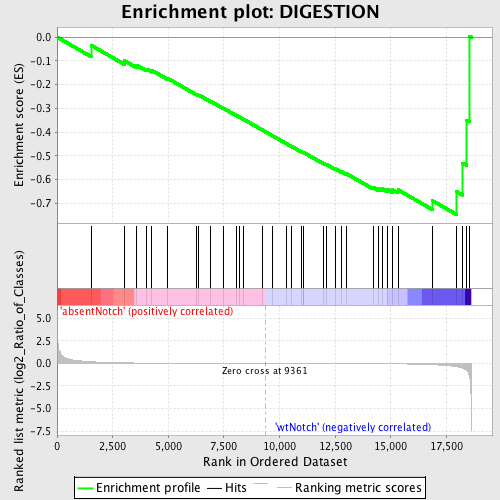
Profile of the Running ES Score & Positions of GeneSet Members on the Rank Ordered List
| Dataset | Set_03_absentNotch_versus_wtNotch.phenotype_absentNotch_versus_wtNotch.cls #absentNotch_versus_wtNotch.phenotype_absentNotch_versus_wtNotch.cls #absentNotch_versus_wtNotch_repos |
| Phenotype | phenotype_absentNotch_versus_wtNotch.cls#absentNotch_versus_wtNotch_repos |
| Upregulated in class | wtNotch |
| GeneSet | DIGESTION |
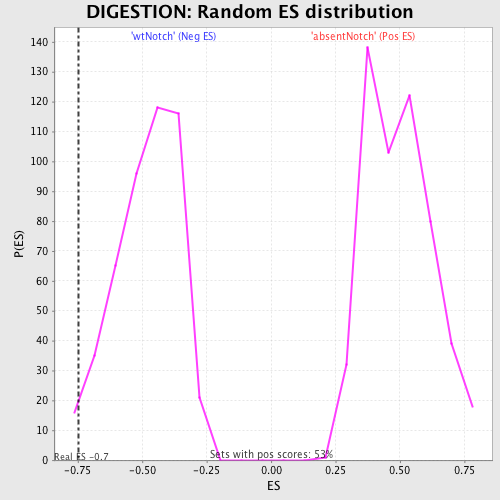
| Enrichment Score (ES) | -0.74675375 |
| Normalized Enrichment Score (NES) | -1.5564995 |
| Nominal p-value | 0.021413276 |
| FDR q-value | 1.0 |
| FWER p-Value | 0.999 |
| PROBE | DESCRIPTION (from dataset) | GENE SYMBOL | GENE_TITLE | RANK IN GENE LIST | RANK METRIC SCORE | RUNNING ES | CORE ENRICHMENT | |
|---|---|---|---|---|---|---|---|---|
| 1 | COPA | 2570519 | 1530 | 0.181 | -0.0345 | No | ||
| 2 | MEP1B | 1240341 5270168 | 3028 | 0.059 | -0.0994 | No | ||
| 3 | CEL | 2640278 | 3580 | 0.040 | -0.1186 | No | ||
| 4 | SLC15A1 | 6370398 | 4026 | 0.030 | -0.1345 | No | ||
| 5 | HTR3A | 3310180 | 4260 | 0.026 | -0.1401 | No | ||
| 6 | VIPR1 | 2480292 5720288 6760537 | 4981 | 0.018 | -0.1741 | No | ||
| 7 | PPYR1 | 1410072 | 6247 | 0.010 | -0.2396 | No | ||
| 8 | GALR2 | 6450739 | 6370 | 0.009 | -0.2437 | No | ||
| 9 | BAAT | 730739 | 6877 | 0.007 | -0.2690 | No | ||
| 10 | CCKBR | 2760128 | 7456 | 0.005 | -0.2987 | No | ||
| 11 | NMU | 6400025 | 8073 | 0.003 | -0.3309 | No | ||
| 12 | PPY | 2340373 | 8184 | 0.003 | -0.3360 | No | ||
| 13 | PPARGC1A | 4670040 | 8390 | 0.003 | -0.3464 | No | ||
| 14 | CYP39A1 | 1170020 5220722 | 9234 | 0.000 | -0.3917 | No | ||
| 15 | TFF2 | 940156 | 9682 | -0.001 | -0.4155 | No | ||
| 16 | MUC2 | 1570025 | 10305 | -0.003 | -0.4483 | No | ||
| 17 | AKR1D1 | 6770026 | 10552 | -0.003 | -0.4607 | No | ||
| 18 | MEP1A | 3140164 | 10979 | -0.004 | -0.4825 | No | ||
| 19 | PGC | 3850446 | 11061 | -0.005 | -0.4856 | No | ||
| 20 | NPC1L1 | 5270458 | 11069 | -0.005 | -0.4847 | No | ||
| 21 | SST | 6590142 | 11982 | -0.008 | -0.5317 | No | ||
| 22 | FABP2 | 5050673 | 12091 | -0.008 | -0.5353 | No | ||
| 23 | CCKAR | 4210079 | 12494 | -0.010 | -0.5542 | No | ||
| 24 | GALR1 | 6020452 | 12792 | -0.012 | -0.5670 | No | ||
| 25 | APOA4 | 4120451 | 13004 | -0.013 | -0.5748 | No | ||
| 26 | CAPN9 | 3450097 5910687 | 14203 | -0.025 | -0.6328 | No | ||
| 27 | ACSL1 | 2900520 | 14450 | -0.029 | -0.6384 | No | ||
| 28 | SSTR1 | 2630471 | 14617 | -0.032 | -0.6390 | No | ||
| 29 | PYY | 2260546 | 14860 | -0.036 | -0.6424 | No | ||
| 30 | LDLR | 5670386 | 15067 | -0.042 | -0.6425 | No | ||
| 31 | SCTR | 2940070 | 15324 | -0.050 | -0.6430 | No | ||
| 32 | CTRL | 2120301 | 16857 | -0.142 | -0.6879 | Yes | ||
| 33 | TFF3 | 1580129 | 17951 | -0.365 | -0.6503 | Yes | ||
| 34 | CTSE | 2030292 | 18225 | -0.511 | -0.5300 | Yes | ||
| 35 | PRSS2 | 1090286 | 18397 | -0.720 | -0.3490 | Yes | ||
| 36 | SSTR2 | 4590687 | 18537 | -1.366 | 0.0043 | Yes |