Profile of the Running ES Score & Positions of GeneSet Members on the Rank Ordered List
| Dataset | Set_03_absentNotch_versus_wtNotch.phenotype_absentNotch_versus_wtNotch.cls #absentNotch_versus_wtNotch.phenotype_absentNotch_versus_wtNotch.cls #absentNotch_versus_wtNotch_repos |
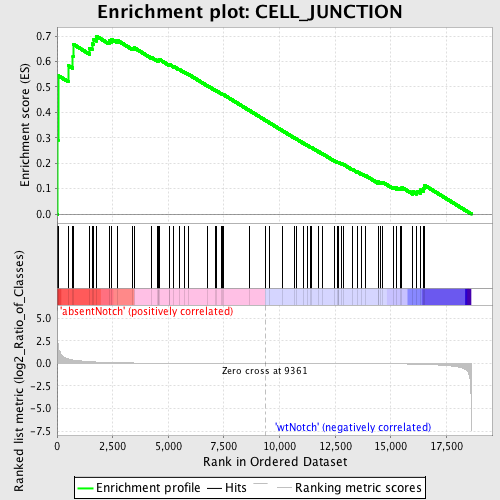
| Phenotype | phenotype_absentNotch_versus_wtNotch.cls#absentNotch_versus_wtNotch_repos |
| Upregulated in class | absentNotch |
| GeneSet | CELL_JUNCTION |
| Enrichment Score (ES) | 0.7002317 |
| Normalized Enrichment Score (NES) | 1.5389707 |
| Nominal p-value | 0.0123893805 |
| FDR q-value | 1.0 |
| FWER p-Value | 1.0 |
| PROBE | DESCRIPTION (from dataset) | GENE SYMBOL | GENE_TITLE | RANK IN GENE LIST | RANK METRIC SCORE | RUNNING ES | CORE ENRICHMENT | |
|---|---|---|---|---|---|---|---|---|
| 1 | GJA1 | 5220731 | 34 | 2.268 | 0.2904 | Yes | ||
| 2 | CLDN4 | 4920739 | 45 | 1.980 | 0.5451 | Yes | ||
| 3 | ACTN2 | 4200435 | 500 | 0.495 | 0.5845 | Yes | ||
| 4 | PDZD3 | 630711 | 711 | 0.374 | 0.6213 | Yes | ||
| 5 | VCL | 4120487 | 724 | 0.370 | 0.6684 | Yes | ||
| 6 | CADM1 | 6620128 | 1462 | 0.191 | 0.6533 | Yes | ||
| 7 | CDC42BPB | 6350037 | 1577 | 0.175 | 0.6697 | Yes | ||
| 8 | VAPA | 2480594 | 1648 | 0.164 | 0.6870 | Yes | ||
| 9 | EVL | 1740113 | 1765 | 0.151 | 0.7002 | Yes | ||
| 10 | CDH1 | 1940736 | 2341 | 0.098 | 0.6819 | No | ||
| 11 | PTPRC | 130402 5290148 | 2453 | 0.091 | 0.6877 | No | ||
| 12 | ASH1L | 2510402 5360687 6650685 | 2720 | 0.075 | 0.6830 | No | ||
| 13 | WNK4 | 1240682 | 3378 | 0.046 | 0.6535 | No | ||
| 14 | CLDN1 | 5670746 | 3463 | 0.043 | 0.6545 | No | ||
| 15 | PARD3 | 3390324 5390541 | 4237 | 0.027 | 0.6163 | No | ||
| 16 | CLDN23 | 4670538 | 4521 | 0.023 | 0.6040 | No | ||
| 17 | CNKSR1 | 730528 3390672 | 4570 | 0.022 | 0.6043 | No | ||
| 18 | CNN2 | 2230433 5270446 | 4577 | 0.022 | 0.6068 | No | ||
| 19 | GJB1 | 1240441 | 4621 | 0.022 | 0.6073 | No | ||
| 20 | RND1 | 5080300 | 5029 | 0.017 | 0.5876 | No | ||
| 21 | CLDN15 | 4150270 4730592 | 5056 | 0.017 | 0.5884 | No | ||
| 22 | ACTN3 | 3140541 6480598 | 5251 | 0.016 | 0.5800 | No | ||
| 23 | TRIP6 | 6520609 | 5485 | 0.014 | 0.5692 | No | ||
| 24 | CDC42BPA | 840671 | 5709 | 0.013 | 0.5589 | No | ||
| 25 | CLDN14 | 5340292 | 5915 | 0.012 | 0.5493 | No | ||
| 26 | BCAR1 | 1340215 | 6775 | 0.008 | 0.5040 | No | ||
| 27 | PGM5 | 2340446 | 7140 | 0.006 | 0.4852 | No | ||
| 28 | CLDN7 | 1190301 | 7164 | 0.006 | 0.4847 | No | ||
| 29 | PARD6B | 4120600 | 7394 | 0.005 | 0.4731 | No | ||
| 30 | CLDN2 | 580053 | 7436 | 0.005 | 0.4716 | No | ||
| 31 | SHROOM3 | 2750451 | 7479 | 0.005 | 0.4700 | No | ||
| 32 | DSC3 | 6840576 | 8665 | 0.002 | 0.4063 | No | ||
| 33 | PNN | 6650504 | 9383 | -0.000 | 0.3677 | No | ||
| 34 | CLDN3 | 2570524 | 9524 | -0.000 | 0.3602 | No | ||
| 35 | DST | 430026 1090035 2340577 3170068 3870112 4780519 6400167 6450358 7040347 | 10116 | -0.002 | 0.3286 | No | ||
| 36 | CLDN8 | 1770113 2320500 | 10670 | -0.004 | 0.2992 | No | ||
| 37 | SORBS3 | 50465 | 10771 | -0.004 | 0.2943 | No | ||
| 38 | TJP1 | 6350184 | 11055 | -0.005 | 0.2797 | No | ||
| 39 | CLDN11 | 670338 | 11266 | -0.005 | 0.2690 | No | ||
| 40 | CLDN10 | 4070364 4590059 4920097 5080687 6620270 | 11409 | -0.006 | 0.2621 | No | ||
| 41 | PDZD2 | 2360086 2650097 4120504 5390010 | 11414 | -0.006 | 0.2627 | No | ||
| 42 | NEXN | 1240017 5290047 | 11765 | -0.007 | 0.2447 | No | ||
| 43 | NRAP | 1780433 | 11945 | -0.008 | 0.2361 | No | ||
| 44 | CLDN17 | 3710672 | 12452 | -0.010 | 0.2101 | No | ||
| 45 | CLDN9 | 840373 | 12618 | -0.011 | 0.2026 | No | ||
| 46 | GJA8 | 7000619 | 12649 | -0.011 | 0.2024 | No | ||
| 47 | RAB13 | 3710309 | 12655 | -0.011 | 0.2036 | No | ||
| 48 | CLDN16 | 1850286 | 12786 | -0.012 | 0.1981 | No | ||
| 49 | DSC1 | 6130400 | 12878 | -0.012 | 0.1948 | No | ||
| 50 | CDH24 | 6980592 | 13255 | -0.015 | 0.1765 | No | ||
| 51 | CADM3 | 6660072 | 13481 | -0.017 | 0.1666 | No | ||
| 52 | COL17A1 | 2030672 5130347 | 13692 | -0.019 | 0.1577 | No | ||
| 53 | BAI1 | 6350053 | 13878 | -0.021 | 0.1504 | No | ||
| 54 | CLDN19 | 2690184 6370240 | 14426 | -0.028 | 0.1246 | No | ||
| 55 | CLDN5 | 6510717 | 14441 | -0.028 | 0.1275 | No | ||
| 56 | CLDN12 | 6350341 | 14557 | -0.031 | 0.1252 | No | ||
| 57 | ZYX | 4730068 | 14621 | -0.032 | 0.1259 | No | ||
| 58 | STEAP1 | 4590575 | 15114 | -0.043 | 0.1050 | No | ||
| 59 | GJB2 | 5900609 6200487 | 15249 | -0.047 | 0.1039 | No | ||
| 60 | AMOTL1 | 380279 | 15420 | -0.054 | 0.1016 | No | ||
| 61 | DLG1 | 2630091 6020286 | 15497 | -0.057 | 0.1048 | No | ||
| 62 | ERBB2IP | 580253 1090672 | 15991 | -0.079 | 0.0883 | No | ||
| 63 | CLDN18 | 2030193 | 16175 | -0.089 | 0.0900 | No | ||
| 64 | PKP4 | 3710400 5890097 | 16321 | -0.099 | 0.0949 | No | ||
| 65 | PARD6A | 4120170 | 16456 | -0.109 | 0.1018 | No | ||
| 66 | B4GALT1 | 6980167 | 16501 | -0.113 | 0.1140 | No |

