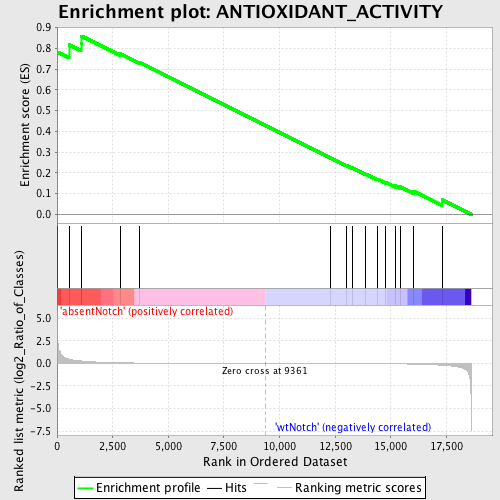
Profile of the Running ES Score & Positions of GeneSet Members on the Rank Ordered List
| Dataset | Set_03_absentNotch_versus_wtNotch.phenotype_absentNotch_versus_wtNotch.cls #absentNotch_versus_wtNotch.phenotype_absentNotch_versus_wtNotch.cls #absentNotch_versus_wtNotch_repos |
| Phenotype | phenotype_absentNotch_versus_wtNotch.cls#absentNotch_versus_wtNotch_repos |
| Upregulated in class | absentNotch |
| GeneSet | ANTIOXIDANT_ACTIVITY |
| Enrichment Score (ES) | 0.85895234 |
| Normalized Enrichment Score (NES) | 1.5294389 |
| Nominal p-value | 0.011741683 |
| FDR q-value | 1.0 |
| FWER p-Value | 1.0 |
| PROBE | DESCRIPTION (from dataset) | GENE SYMBOL | GENE_TITLE | RANK IN GENE LIST | RANK METRIC SCORE | RUNNING ES | CORE ENRICHMENT | |
|---|---|---|---|---|---|---|---|---|
| 1 | PRDX2 | 6760095 4010619 5340577 | 0 | 5.791 | 0.7825 | Yes | ||
| 2 | MGST3 | 3450338 5290736 | 536 | 0.474 | 0.8178 | Yes | ||
| 3 | PRDX4 | 3800039 | 1074 | 0.267 | 0.8250 | Yes | ||
| 4 | GSTZ1 | 7000451 | 1098 | 0.261 | 0.8590 | Yes | ||
| 5 | MPO | 2360176 2760440 5690176 | 2856 | 0.067 | 0.7736 | No | ||
| 6 | TXNRD1 | 6590446 | 3713 | 0.037 | 0.7325 | No | ||
| 7 | TXNDC2 | 1410687 | 12296 | -0.009 | 0.2724 | No | ||
| 8 | APOA4 | 4120451 | 13004 | -0.013 | 0.2362 | No | ||
| 9 | GPX2 | 6940619 | 13261 | -0.015 | 0.2245 | No | ||
| 10 | EPX | 940022 | 13876 | -0.021 | 0.1943 | No | ||
| 11 | CAT | 4280152 | 14384 | -0.028 | 0.1708 | No | ||
| 12 | GSR | 3520079 | 14782 | -0.035 | 0.1541 | No | ||
| 13 | GPX3 | 1340450 | 15196 | -0.046 | 0.1381 | No | ||
| 14 | GPX4 | 5080433 | 15428 | -0.054 | 0.1330 | No | ||
| 15 | TXNRD2 | 2510398 3780451 | 16021 | -0.081 | 0.1120 | No | ||
| 16 | CYGB | 870347 | 17300 | -0.203 | 0.0707 | No |

