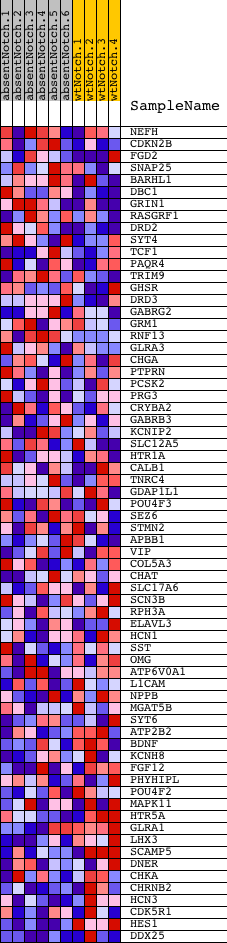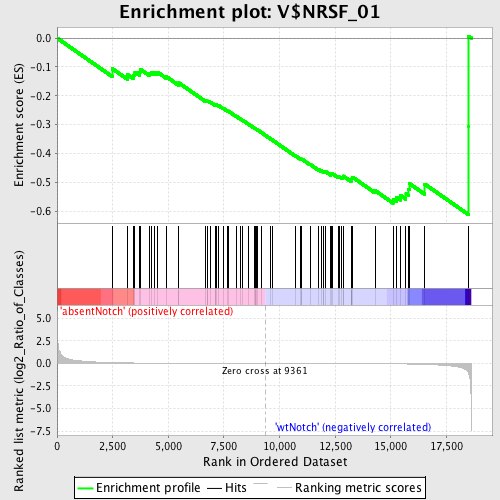
Profile of the Running ES Score & Positions of GeneSet Members on the Rank Ordered List
| Dataset | Set_03_absentNotch_versus_wtNotch.phenotype_absentNotch_versus_wtNotch.cls #absentNotch_versus_wtNotch.phenotype_absentNotch_versus_wtNotch.cls #absentNotch_versus_wtNotch_repos |
| Phenotype | phenotype_absentNotch_versus_wtNotch.cls#absentNotch_versus_wtNotch_repos |
| Upregulated in class | wtNotch |
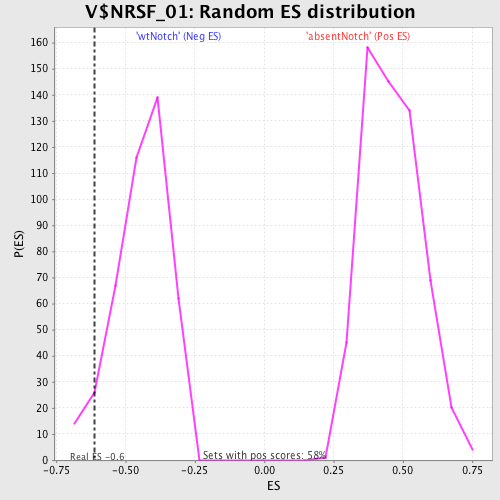
| GeneSet | V$NRSF_01 |
| Enrichment Score (ES) | -0.6116693 |
| Normalized Enrichment Score (NES) | -1.3869172 |
| Nominal p-value | 0.051886793 |
| FDR q-value | 1.0 |
| FWER p-Value | 1.0 |
| PROBE | DESCRIPTION (from dataset) | GENE SYMBOL | GENE_TITLE | RANK IN GENE LIST | RANK METRIC SCORE | RUNNING ES | CORE ENRICHMENT | |
|---|---|---|---|---|---|---|---|---|
| 1 | NEFH | 630239 | 2480 | 0.090 | -0.1061 | No | ||
| 2 | CDKN2B | 6020040 | 3172 | 0.053 | -0.1270 | No | ||
| 3 | FGD2 | 5340195 | 3442 | 0.044 | -0.1280 | No | ||
| 4 | SNAP25 | 360520 | 3495 | 0.042 | -0.1178 | No | ||
| 5 | BARHL1 | 4210113 | 3706 | 0.037 | -0.1177 | No | ||
| 6 | DBC1 | 4610156 | 3729 | 0.036 | -0.1077 | No | ||
| 7 | GRIN1 | 3800014 7000609 | 4163 | 0.028 | -0.1224 | No | ||
| 8 | RASGRF1 | 730068 6940402 | 4242 | 0.027 | -0.1184 | No | ||
| 9 | DRD2 | 5890369 | 4379 | 0.025 | -0.1181 | No | ||
| 10 | SYT4 | 5080193 | 4507 | 0.023 | -0.1178 | No | ||
| 11 | TCF1 | 5390022 | 4921 | 0.018 | -0.1344 | No | ||
| 12 | PAQR4 | 730736 | 5469 | 0.014 | -0.1595 | No | ||
| 13 | TRIM9 | 1230672 2120162 6450100 6450687 | 5474 | 0.014 | -0.1554 | No | ||
| 14 | GHSR | 1980465 7050521 | 6679 | 0.008 | -0.2178 | No | ||
| 15 | DRD3 | 4780402 | 6739 | 0.008 | -0.2186 | No | ||
| 16 | GABRG2 | 2350402 4210204 6130279 6550037 | 6773 | 0.008 | -0.2180 | No | ||
| 17 | GRM1 | 5890324 | 6901 | 0.007 | -0.2227 | No | ||
| 18 | RNF13 | 2370021 | 7120 | 0.006 | -0.2325 | No | ||
| 19 | GLRA3 | 2570500 | 7136 | 0.006 | -0.2314 | No | ||
| 20 | CHGA | 1990056 6550463 | 7156 | 0.006 | -0.2305 | No | ||
| 21 | PTPRN | 5900577 | 7257 | 0.006 | -0.2341 | No | ||
| 22 | PCSK2 | 360017 430528 5900619 | 7469 | 0.005 | -0.2438 | No | ||
| 23 | PRG3 | 6220020 | 7668 | 0.005 | -0.2531 | No | ||
| 24 | CRYBA2 | 5900138 | 7688 | 0.005 | -0.2527 | No | ||
| 25 | GABRB3 | 4150164 | 8053 | 0.004 | -0.2712 | No | ||
| 26 | KCNIP2 | 60088 1780324 | 8263 | 0.003 | -0.2816 | No | ||
| 27 | SLC12A5 | 1980692 | 8343 | 0.003 | -0.2850 | No | ||
| 28 | HTR1A | 6980441 | 8608 | 0.002 | -0.2987 | No | ||
| 29 | CALB1 | 460070 | 8880 | 0.001 | -0.3129 | No | ||
| 30 | TNRC4 | 4050156 | 8906 | 0.001 | -0.3139 | No | ||
| 31 | GDAP1L1 | 1660066 | 8929 | 0.001 | -0.3148 | No | ||
| 32 | POU4F3 | 2690035 | 8957 | 0.001 | -0.3159 | No | ||
| 33 | SEZ6 | 3450722 | 9003 | 0.001 | -0.3181 | No | ||
| 34 | STMN2 | 6220181 | 9185 | 0.000 | -0.3277 | No | ||
| 35 | APBB1 | 2690338 | 9604 | -0.001 | -0.3500 | No | ||
| 36 | VIP | 2850647 | 9664 | -0.001 | -0.3530 | No | ||
| 37 | COL5A3 | 1940471 | 10728 | -0.004 | -0.4091 | No | ||
| 38 | CHAT | 6840603 | 10937 | -0.004 | -0.4190 | No | ||
| 39 | SLC17A6 | 4210576 | 10970 | -0.004 | -0.4194 | No | ||
| 40 | SCN3B | 840112 1780152 5910685 6100131 | 10993 | -0.005 | -0.4192 | No | ||
| 41 | RPH3A | 2190156 | 11373 | -0.006 | -0.4378 | No | ||
| 42 | ELAVL3 | 2850014 | 11746 | -0.007 | -0.4557 | No | ||
| 43 | HCN1 | 5130458 | 11862 | -0.007 | -0.4596 | No | ||
| 44 | SST | 6590142 | 11982 | -0.008 | -0.4635 | No | ||
| 45 | OMG | 6760066 | 11988 | -0.008 | -0.4613 | No | ||
| 46 | ATP6V0A1 | 1570082 3870441 4230044 | 12064 | -0.008 | -0.4628 | No | ||
| 47 | L1CAM | 4850021 | 12297 | -0.009 | -0.4725 | No | ||
| 48 | NPPB | 4150722 | 12322 | -0.009 | -0.4708 | No | ||
| 49 | MGAT5B | 380131 2570364 | 12379 | -0.010 | -0.4708 | No | ||
| 50 | SYT6 | 2510280 3850128 4540064 | 12636 | -0.011 | -0.4813 | No | ||
| 51 | ATP2B2 | 3780397 | 12708 | -0.011 | -0.4816 | No | ||
| 52 | BDNF | 2940128 3520368 | 12799 | -0.012 | -0.4827 | No | ||
| 53 | KCNH8 | 3940129 | 12851 | -0.012 | -0.4817 | No | ||
| 54 | FGF12 | 1740446 2360037 | 12857 | -0.012 | -0.4782 | No | ||
| 55 | PHYHIPL | 2360706 3840692 | 13215 | -0.015 | -0.4929 | No | ||
| 56 | POU4F2 | 2120195 2570022 | 13229 | -0.015 | -0.4890 | No | ||
| 57 | MAPK11 | 130452 3120440 3610465 | 13252 | -0.015 | -0.4855 | No | ||
| 58 | HTR5A | 1940253 | 13284 | -0.015 | -0.4825 | No | ||
| 59 | GLRA1 | 610575 | 14297 | -0.026 | -0.5290 | No | ||
| 60 | LHX3 | 670164 1770280 | 15100 | -0.043 | -0.5590 | Yes | ||
| 61 | SCAMP5 | 5550368 6290021 | 15259 | -0.048 | -0.5528 | Yes | ||
| 62 | DNER | 3610170 | 15423 | -0.054 | -0.5451 | Yes | ||
| 63 | CHKA | 510324 | 15681 | -0.064 | -0.5393 | Yes | ||
| 64 | CHRNB2 | 580204 3120739 | 15798 | -0.069 | -0.5243 | Yes | ||
| 65 | HCN3 | 3940438 6840750 | 15837 | -0.071 | -0.5045 | Yes | ||
| 66 | CDK5R1 | 3870161 | 16529 | -0.115 | -0.5064 | Yes | ||
| 67 | HES1 | 4810280 | 18482 | -0.988 | -0.3069 | Yes | ||
| 68 | DDX25 | 5910121 | 18488 | -1.019 | 0.0069 | Yes |