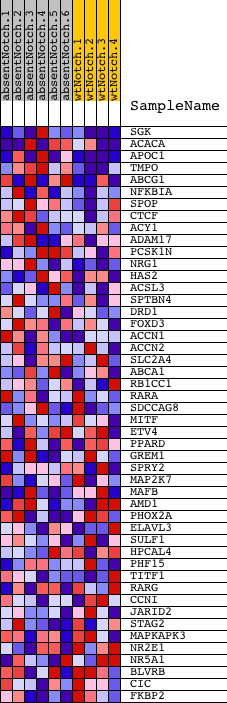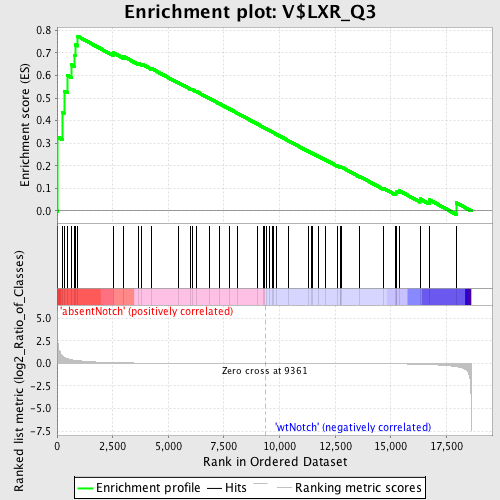
Profile of the Running ES Score & Positions of GeneSet Members on the Rank Ordered List
| Dataset | Set_03_absentNotch_versus_wtNotch.phenotype_absentNotch_versus_wtNotch.cls #absentNotch_versus_wtNotch.phenotype_absentNotch_versus_wtNotch.cls #absentNotch_versus_wtNotch_repos |
| Phenotype | phenotype_absentNotch_versus_wtNotch.cls#absentNotch_versus_wtNotch_repos |
| Upregulated in class | absentNotch |
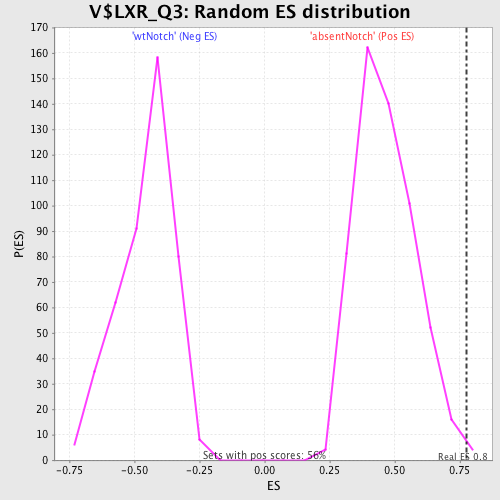
| GeneSet | V$LXR_Q3 |
| Enrichment Score (ES) | 0.7746827 |
| Normalized Enrichment Score (NES) | 1.6598201 |
| Nominal p-value | 0.007142857 |
| FDR q-value | 0.10040567 |
| FWER p-Value | 0.207 |
| PROBE | DESCRIPTION (from dataset) | GENE SYMBOL | GENE_TITLE | RANK IN GENE LIST | RANK METRIC SCORE | RUNNING ES | CORE ENRICHMENT | |
|---|---|---|---|---|---|---|---|---|
| 1 | SGK | 1400131 2480056 | 32 | 2.307 | 0.3272 | Yes | ||
| 2 | ACACA | 2490612 2680369 | 235 | 0.843 | 0.4364 | Yes | ||
| 3 | APOC1 | 5900066 6220408 | 312 | 0.695 | 0.5314 | Yes | ||
| 4 | TMPO | 4050494 | 458 | 0.538 | 0.6003 | Yes | ||
| 5 | ABCG1 | 60692 | 648 | 0.404 | 0.6477 | Yes | ||
| 6 | NFKBIA | 1570152 | 786 | 0.347 | 0.6898 | Yes | ||
| 7 | SPOP | 450035 | 810 | 0.337 | 0.7366 | Yes | ||
| 8 | CTCF | 5340017 | 918 | 0.307 | 0.7747 | Yes | ||
| 9 | ACY1 | 2360279 6550161 | 2518 | 0.087 | 0.7010 | No | ||
| 10 | ADAM17 | 360292 | 2989 | 0.061 | 0.6844 | No | ||
| 11 | PCSK1N | 4010435 | 3668 | 0.038 | 0.6533 | No | ||
| 12 | NRG1 | 1050332 | 3813 | 0.035 | 0.6505 | No | ||
| 13 | HAS2 | 5360181 | 4258 | 0.026 | 0.6303 | No | ||
| 14 | ACSL3 | 3140195 | 5465 | 0.014 | 0.5674 | No | ||
| 15 | SPTBN4 | 4150279 5270286 | 6007 | 0.011 | 0.5399 | No | ||
| 16 | DRD1 | 430025 | 6076 | 0.011 | 0.5377 | No | ||
| 17 | FOXD3 | 6550156 | 6263 | 0.010 | 0.5291 | No | ||
| 18 | ACCN1 | 2060139 2190541 | 6839 | 0.007 | 0.4992 | No | ||
| 19 | ACCN2 | 6450465 | 7311 | 0.006 | 0.4746 | No | ||
| 20 | SLC2A4 | 540441 | 7754 | 0.004 | 0.4515 | No | ||
| 21 | ABCA1 | 6290156 | 8101 | 0.003 | 0.4333 | No | ||
| 22 | RB1CC1 | 510494 7100072 | 9024 | 0.001 | 0.3838 | No | ||
| 23 | RARA | 4050161 | 9286 | 0.000 | 0.3697 | No | ||
| 24 | SDCCAG8 | 1780687 | 9343 | 0.000 | 0.3667 | No | ||
| 25 | MITF | 380056 | 9394 | -0.000 | 0.3640 | No | ||
| 26 | ETV4 | 2450605 | 9555 | -0.000 | 0.3555 | No | ||
| 27 | PPARD | 110131 | 9663 | -0.001 | 0.3498 | No | ||
| 28 | GREM1 | 3940180 | 9716 | -0.001 | 0.3472 | No | ||
| 29 | SPRY2 | 5860184 | 9878 | -0.001 | 0.3387 | No | ||
| 30 | MAP2K7 | 2260086 | 10416 | -0.003 | 0.3102 | No | ||
| 31 | MAFB | 1230471 | 11277 | -0.005 | 0.2646 | No | ||
| 32 | AMD1 | 6290128 | 11451 | -0.006 | 0.2561 | No | ||
| 33 | PHOX2A | 6650121 | 11456 | -0.006 | 0.2568 | No | ||
| 34 | ELAVL3 | 2850014 | 11746 | -0.007 | 0.2422 | No | ||
| 35 | SULF1 | 430575 | 12072 | -0.008 | 0.2259 | No | ||
| 36 | HPCAL4 | 2600484 | 12587 | -0.011 | 0.1998 | No | ||
| 37 | PHF15 | 6550066 6860673 | 12731 | -0.012 | 0.1937 | No | ||
| 38 | TITF1 | 3390554 4540292 | 12732 | -0.012 | 0.1954 | No | ||
| 39 | RARG | 6760136 | 12788 | -0.012 | 0.1941 | No | ||
| 40 | CCNI | 1340020 | 13604 | -0.018 | 0.1528 | No | ||
| 41 | JARID2 | 6290538 | 14682 | -0.033 | 0.0995 | No | ||
| 42 | STAG2 | 4540132 | 15201 | -0.046 | 0.0781 | No | ||
| 43 | MAPKAPK3 | 630520 | 15240 | -0.047 | 0.0827 | No | ||
| 44 | NR2E1 | 4730288 | 15273 | -0.048 | 0.0879 | No | ||
| 45 | NR5A1 | 70707 | 15374 | -0.052 | 0.0899 | No | ||
| 46 | BLVRB | 7040707 | 16312 | -0.098 | 0.0535 | No | ||
| 47 | CIC | 6370161 | 16731 | -0.131 | 0.0496 | No | ||
| 48 | FKBP2 | 2320025 | 17944 | -0.364 | 0.0362 | No |