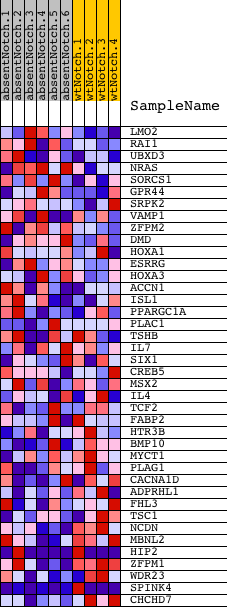
Profile of the Running ES Score & Positions of GeneSet Members on the Rank Ordered List
| Dataset | Set_03_absentNotch_versus_wtNotch.phenotype_absentNotch_versus_wtNotch.cls #absentNotch_versus_wtNotch.phenotype_absentNotch_versus_wtNotch.cls #absentNotch_versus_wtNotch_repos |
| Phenotype | phenotype_absentNotch_versus_wtNotch.cls#absentNotch_versus_wtNotch_repos |
| Upregulated in class | wtNotch |
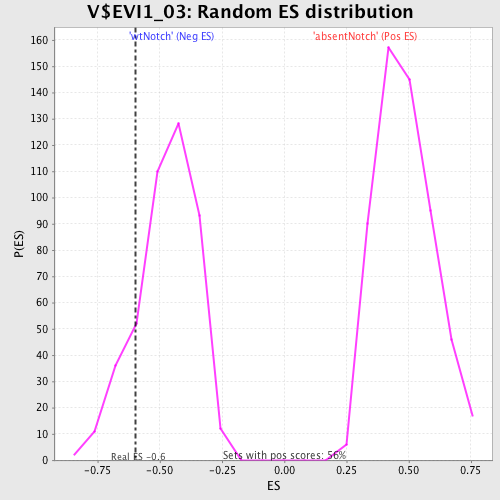
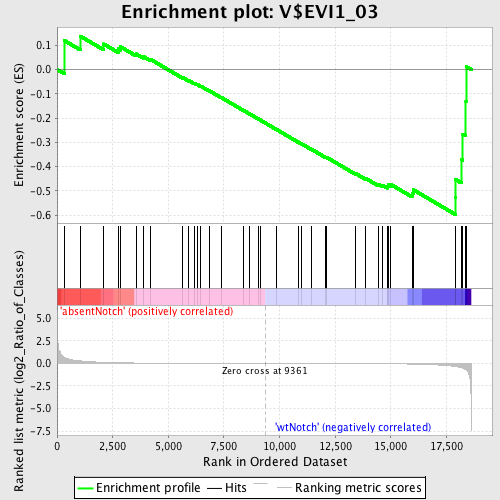
| GeneSet | V$EVI1_03 |
| Enrichment Score (ES) | -0.5972721 |
| Normalized Enrichment Score (NES) | -1.262186 |
| Nominal p-value | 0.16216215 |
| FDR q-value | 1.0 |
| FWER p-Value | 1.0 |
| PROBE | DESCRIPTION (from dataset) | GENE SYMBOL | GENE_TITLE | RANK IN GENE LIST | RANK METRIC SCORE | RUNNING ES | CORE ENRICHMENT | |
|---|---|---|---|---|---|---|---|---|
| 1 | LMO2 | 5360450 | 333 | 0.665 | 0.1190 | No | ||
| 2 | RAI1 | 110377 5340670 | 1039 | 0.275 | 0.1377 | No | ||
| 3 | UBXD3 | 5050193 | 2093 | 0.118 | 0.1053 | No | ||
| 4 | NRAS | 6900577 | 2751 | 0.073 | 0.0849 | No | ||
| 5 | SORCS1 | 60411 5890373 | 2839 | 0.068 | 0.0942 | No | ||
| 6 | GPR44 | 4050452 | 3554 | 0.041 | 0.0642 | No | ||
| 7 | SRPK2 | 6380341 | 3900 | 0.032 | 0.0523 | No | ||
| 8 | VAMP1 | 450735 1940707 | 4196 | 0.027 | 0.0420 | No | ||
| 9 | ZFPM2 | 460072 | 5656 | 0.013 | -0.0338 | No | ||
| 10 | DMD | 1740041 3990332 | 5912 | 0.012 | -0.0452 | No | ||
| 11 | HOXA1 | 1190524 5420142 | 6173 | 0.010 | -0.0571 | No | ||
| 12 | ESRRG | 4010181 | 6290 | 0.010 | -0.0613 | No | ||
| 13 | HOXA3 | 3610632 6020358 | 6457 | 0.009 | -0.0684 | No | ||
| 14 | ACCN1 | 2060139 2190541 | 6839 | 0.007 | -0.0874 | No | ||
| 15 | ISL1 | 4810239 | 7367 | 0.006 | -0.1146 | No | ||
| 16 | PPARGC1A | 4670040 | 8390 | 0.003 | -0.1691 | No | ||
| 17 | PLAC1 | 2350594 | 8667 | 0.002 | -0.1836 | No | ||
| 18 | TSHB | 6770500 | 9044 | 0.001 | -0.2037 | No | ||
| 19 | IL7 | 5360440 | 9156 | 0.001 | -0.2095 | No | ||
| 20 | SIX1 | 6760471 | 9844 | -0.001 | -0.2462 | No | ||
| 21 | CREB5 | 2320368 | 10828 | -0.004 | -0.2983 | No | ||
| 22 | MSX2 | 1570022 | 10962 | -0.004 | -0.3046 | No | ||
| 23 | IL4 | 6020537 | 11441 | -0.006 | -0.3291 | No | ||
| 24 | TCF2 | 870338 5050632 | 12076 | -0.008 | -0.3615 | No | ||
| 25 | FABP2 | 5050673 | 12091 | -0.008 | -0.3605 | No | ||
| 26 | HTR3B | 430438 520301 | 13403 | -0.016 | -0.4277 | No | ||
| 27 | BMP10 | 3060068 | 13854 | -0.021 | -0.4477 | No | ||
| 28 | MYCT1 | 5670044 | 14437 | -0.028 | -0.4732 | No | ||
| 29 | PLAG1 | 1450142 3870139 6520039 | 14620 | -0.032 | -0.4765 | No | ||
| 30 | CACNA1D | 1740315 4730731 | 14842 | -0.036 | -0.4809 | No | ||
| 31 | ADPRHL1 | 4150133 6650300 | 14880 | -0.037 | -0.4753 | No | ||
| 32 | FHL3 | 1090369 2650017 | 14980 | -0.040 | -0.4725 | No | ||
| 33 | TSC1 | 1850672 | 15956 | -0.077 | -0.5091 | No | ||
| 34 | NCDN | 50040 1980739 3520603 | 16013 | -0.080 | -0.4956 | No | ||
| 35 | MBNL2 | 3450707 | 17902 | -0.348 | -0.5256 | Yes | ||
| 36 | HIP2 | 2810095 3990369 4120301 | 17916 | -0.353 | -0.4536 | Yes | ||
| 37 | ZFPM1 | 6760093 | 18168 | -0.469 | -0.3705 | Yes | ||
| 38 | WDR23 | 2030372 | 18240 | -0.523 | -0.2666 | Yes | ||
| 39 | SPINK4 | 4610619 | 18376 | -0.689 | -0.1320 | Yes | ||
| 40 | CHCHD7 | 6620692 | 18386 | -0.704 | 0.0124 | Yes |