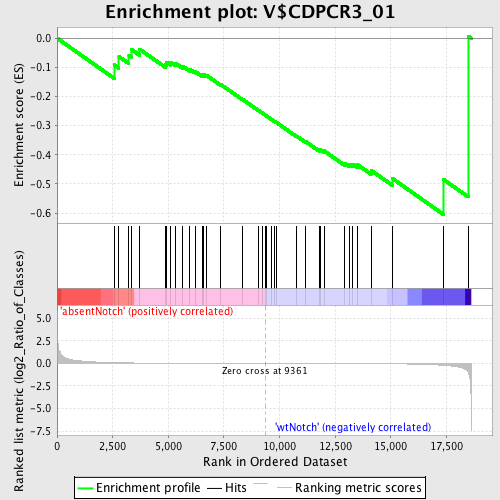
Profile of the Running ES Score & Positions of GeneSet Members on the Rank Ordered List
| Dataset | Set_03_absentNotch_versus_wtNotch.phenotype_absentNotch_versus_wtNotch.cls #absentNotch_versus_wtNotch.phenotype_absentNotch_versus_wtNotch.cls #absentNotch_versus_wtNotch_repos |
| Phenotype | phenotype_absentNotch_versus_wtNotch.cls#absentNotch_versus_wtNotch_repos |
| Upregulated in class | wtNotch |
| GeneSet | V$CDPCR3_01 |
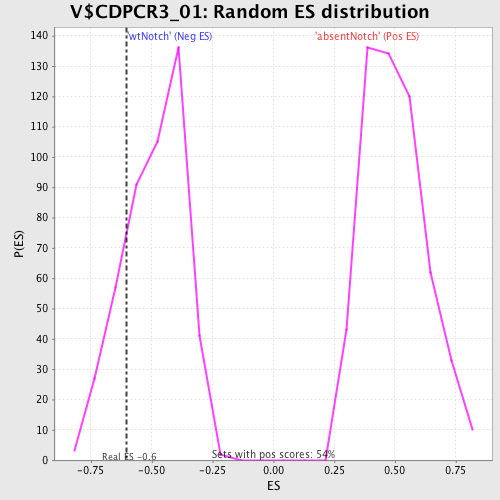
| Enrichment Score (ES) | -0.60486805 |
| Normalized Enrichment Score (NES) | -1.2368271 |
| Nominal p-value | 0.18614718 |
| FDR q-value | 1.0 |
| FWER p-Value | 1.0 |
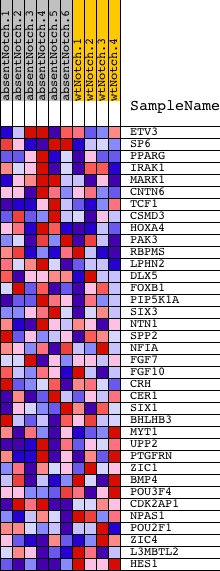
| PROBE | DESCRIPTION (from dataset) | GENE SYMBOL | GENE_TITLE | RANK IN GENE LIST | RANK METRIC SCORE | RUNNING ES | CORE ENRICHMENT | |
|---|---|---|---|---|---|---|---|---|
| 1 | ETV3 | 5360487 | 2565 | 0.083 | -0.0915 | No | ||
| 2 | SP6 | 60484 510452 2690333 | 2780 | 0.071 | -0.0632 | No | ||
| 3 | PPARG | 1990168 2680603 6130632 | 3229 | 0.051 | -0.0587 | No | ||
| 4 | IRAK1 | 4120593 | 3340 | 0.047 | -0.0386 | No | ||
| 5 | MARK1 | 450484 | 3714 | 0.037 | -0.0381 | No | ||
| 6 | CNTN6 | 2630711 | 4883 | 0.019 | -0.0906 | No | ||
| 7 | TCF1 | 5390022 | 4921 | 0.018 | -0.0822 | No | ||
| 8 | CSMD3 | 1660427 1940687 | 5105 | 0.017 | -0.0827 | No | ||
| 9 | HOXA4 | 940152 | 5326 | 0.015 | -0.0861 | No | ||
| 10 | PAK3 | 4210136 | 5641 | 0.013 | -0.0956 | No | ||
| 11 | RBPMS | 3990494 | 5962 | 0.011 | -0.1066 | No | ||
| 12 | LPHN2 | 4480010 | 6202 | 0.010 | -0.1138 | No | ||
| 13 | DLX5 | 5130519 6040021 | 6538 | 0.009 | -0.1271 | No | ||
| 14 | FOXB1 | 4920270 5290463 | 6562 | 0.008 | -0.1236 | No | ||
| 15 | PIP5K1A | 4560672 | 6703 | 0.008 | -0.1267 | No | ||
| 16 | SIX3 | 3830402 | 7360 | 0.006 | -0.1589 | No | ||
| 17 | NTN1 | 5700600 | 8334 | 0.003 | -0.2098 | No | ||
| 18 | SPP2 | 3840253 | 9035 | 0.001 | -0.2470 | No | ||
| 19 | NFIA | 2760129 5860278 | 9224 | 0.000 | -0.2569 | No | ||
| 20 | FGF7 | 5390484 | 9359 | 0.000 | -0.2641 | No | ||
| 21 | FGF10 | 730458 840706 | 9415 | -0.000 | -0.2670 | No | ||
| 22 | CRH | 3710301 | 9632 | -0.001 | -0.2783 | No | ||
| 23 | CER1 | 840102 | 9772 | -0.001 | -0.2852 | No | ||
| 24 | SIX1 | 6760471 | 9844 | -0.001 | -0.2883 | No | ||
| 25 | BHLHB3 | 3450438 | 10762 | -0.004 | -0.3356 | No | ||
| 26 | MYT1 | 6770524 | 11180 | -0.005 | -0.3552 | No | ||
| 27 | UPP2 | 2190091 2680746 6940647 | 11782 | -0.007 | -0.3835 | No | ||
| 28 | PTGFRN | 4120524 | 11831 | -0.007 | -0.3820 | No | ||
| 29 | ZIC1 | 670113 | 11999 | -0.008 | -0.3865 | No | ||
| 30 | BMP4 | 380113 | 12935 | -0.013 | -0.4296 | No | ||
| 31 | POU3F4 | 870274 | 13143 | -0.014 | -0.4328 | No | ||
| 32 | CDK2AP1 | 2340156 | 13292 | -0.015 | -0.4322 | No | ||
| 33 | NPAS1 | 5570020 | 13506 | -0.017 | -0.4341 | No | ||
| 34 | POU2F1 | 70577 430373 4850324 5910056 | 14111 | -0.024 | -0.4534 | No | ||
| 35 | ZIC4 | 1500082 | 15082 | -0.042 | -0.4819 | No | ||
| 36 | L3MBTL2 | 6020341 | 17367 | -0.215 | -0.4848 | Yes | ||
| 37 | HES1 | 4810280 | 18482 | -0.988 | 0.0072 | Yes |