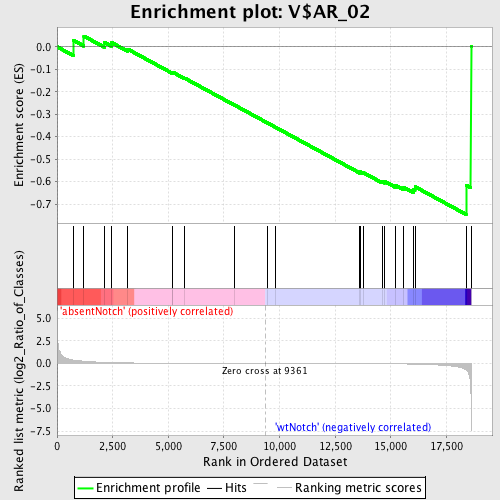
Profile of the Running ES Score & Positions of GeneSet Members on the Rank Ordered List
| Dataset | Set_03_absentNotch_versus_wtNotch.phenotype_absentNotch_versus_wtNotch.cls #absentNotch_versus_wtNotch.phenotype_absentNotch_versus_wtNotch.cls #absentNotch_versus_wtNotch_repos |
| Phenotype | phenotype_absentNotch_versus_wtNotch.cls#absentNotch_versus_wtNotch_repos |
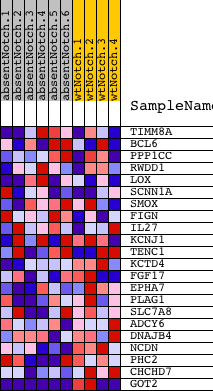
| Upregulated in class | wtNotch |
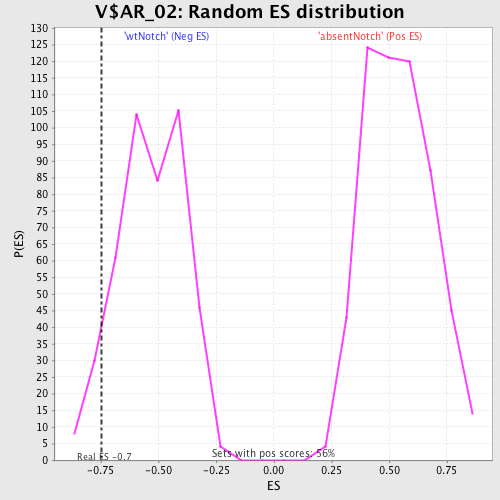
| GeneSet | V$AR_02 |
| Enrichment Score (ES) | -0.74599653 |
| Normalized Enrichment Score (NES) | -1.4038633 |
| Nominal p-value | 0.07918552 |
| FDR q-value | 1.0 |
| FWER p-Value | 1.0 |
| PROBE | DESCRIPTION (from dataset) | GENE SYMBOL | GENE_TITLE | RANK IN GENE LIST | RANK METRIC SCORE | RUNNING ES | CORE ENRICHMENT | |
|---|---|---|---|---|---|---|---|---|
| 1 | TIMM8A | 110279 | 726 | 0.369 | 0.0290 | No | ||
| 2 | BCL6 | 940100 | 1204 | 0.240 | 0.0476 | No | ||
| 3 | PPP1CC | 6380300 2510647 | 2118 | 0.116 | 0.0198 | No | ||
| 4 | RWDD1 | 1850204 | 2456 | 0.091 | 0.0185 | No | ||
| 5 | LOX | 5340372 | 3169 | 0.053 | -0.0100 | No | ||
| 6 | SCNN1A | 4730019 | 5185 | 0.016 | -0.1154 | No | ||
| 7 | SMOX | 50019 1940398 3390164 5050672 | 5190 | 0.016 | -0.1126 | No | ||
| 8 | FIGN | 7000601 | 5731 | 0.013 | -0.1393 | No | ||
| 9 | IL27 | 1990324 | 7979 | 0.004 | -0.2595 | No | ||
| 10 | KCNJ1 | 610707 870181 | 9436 | -0.000 | -0.3377 | No | ||
| 11 | TENC1 | 1980403 7050575 | 9811 | -0.001 | -0.3577 | No | ||
| 12 | KCTD4 | 1980156 | 13612 | -0.018 | -0.5587 | No | ||
| 13 | FGF17 | 3130022 | 13620 | -0.018 | -0.5557 | No | ||
| 14 | EPHA7 | 1190288 4010278 | 13765 | -0.020 | -0.5598 | No | ||
| 15 | PLAG1 | 1450142 3870139 6520039 | 14620 | -0.032 | -0.5999 | No | ||
| 16 | SLC7A8 | 380136 5690672 | 14737 | -0.034 | -0.5999 | No | ||
| 17 | ADCY6 | 450364 6290670 6940286 | 15211 | -0.046 | -0.6168 | No | ||
| 18 | DNAJB4 | 380195 2760372 3940735 | 15582 | -0.060 | -0.6257 | No | ||
| 19 | NCDN | 50040 1980739 3520603 | 16013 | -0.080 | -0.6341 | Yes | ||
| 20 | PHC2 | 1430433 | 16087 | -0.085 | -0.6224 | Yes | ||
| 21 | CHCHD7 | 6620692 | 18386 | -0.704 | -0.6163 | Yes | ||
| 22 | GOT2 | 4570164 5220450 | 18603 | -3.412 | 0.0007 | Yes |