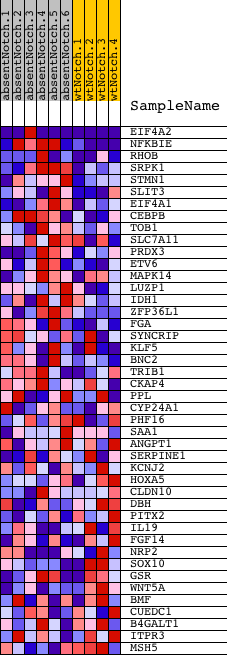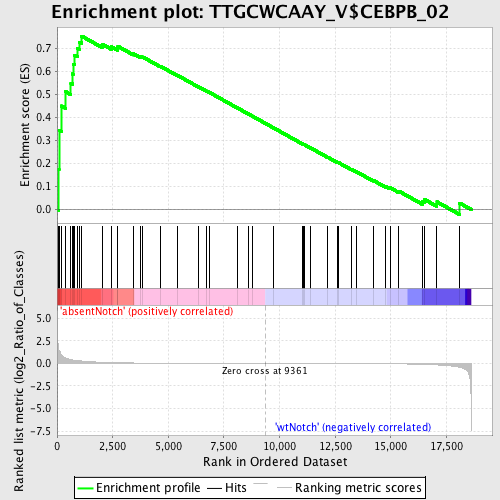
Profile of the Running ES Score & Positions of GeneSet Members on the Rank Ordered List
| Dataset | Set_03_absentNotch_versus_wtNotch.phenotype_absentNotch_versus_wtNotch.cls #absentNotch_versus_wtNotch.phenotype_absentNotch_versus_wtNotch.cls #absentNotch_versus_wtNotch_repos |
| Phenotype | phenotype_absentNotch_versus_wtNotch.cls#absentNotch_versus_wtNotch_repos |
| Upregulated in class | absentNotch |
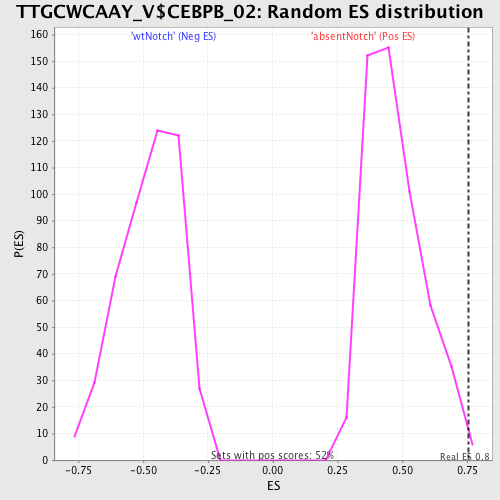
| GeneSet | TTGCWCAAY_V$CEBPB_02 |
| Enrichment Score (ES) | 0.7538029 |
| Normalized Enrichment Score (NES) | 1.604235 |
| Nominal p-value | 0.0038240917 |
| FDR q-value | 0.18536545 |
| FWER p-Value | 0.515 |
| PROBE | DESCRIPTION (from dataset) | GENE SYMBOL | GENE_TITLE | RANK IN GENE LIST | RANK METRIC SCORE | RUNNING ES | CORE ENRICHMENT | |
|---|---|---|---|---|---|---|---|---|
| 1 | EIF4A2 | 1170494 1740711 2850504 | 72 | 1.519 | 0.1762 | Yes | ||
| 2 | NFKBIE | 580390 2190086 | 88 | 1.423 | 0.3442 | Yes | ||
| 3 | RHOB | 1500309 | 189 | 0.940 | 0.4503 | Yes | ||
| 4 | SRPK1 | 450110 | 382 | 0.611 | 0.5123 | Yes | ||
| 5 | STMN1 | 1990717 | 620 | 0.416 | 0.5489 | Yes | ||
| 6 | SLIT3 | 7100132 | 701 | 0.379 | 0.5896 | Yes | ||
| 7 | EIF4A1 | 1990341 2810300 | 721 | 0.371 | 0.6325 | Yes | ||
| 8 | CEBPB | 2970019 | 782 | 0.348 | 0.6706 | Yes | ||
| 9 | TOB1 | 4150138 | 922 | 0.306 | 0.6994 | Yes | ||
| 10 | SLC7A11 | 2850138 | 1013 | 0.280 | 0.7278 | Yes | ||
| 11 | PRDX3 | 1690035 | 1103 | 0.260 | 0.7538 | Yes | ||
| 12 | ETV6 | 610524 | 2027 | 0.123 | 0.7187 | No | ||
| 13 | MAPK14 | 5290731 | 2442 | 0.092 | 0.7074 | No | ||
| 14 | LUZP1 | 940075 4280458 6180070 | 2714 | 0.075 | 0.7016 | No | ||
| 15 | IDH1 | 1990021 | 2731 | 0.074 | 0.7095 | No | ||
| 16 | ZFP36L1 | 2510138 4120048 | 3434 | 0.044 | 0.6769 | No | ||
| 17 | FGA | 4210056 5220239 | 3749 | 0.036 | 0.6643 | No | ||
| 18 | SYNCRIP | 1690195 3140113 4670279 | 3845 | 0.034 | 0.6632 | No | ||
| 19 | KLF5 | 3840348 | 4651 | 0.021 | 0.6224 | No | ||
| 20 | BNC2 | 4810603 | 5388 | 0.015 | 0.5845 | No | ||
| 21 | TRIB1 | 2320435 | 6374 | 0.009 | 0.5326 | No | ||
| 22 | CKAP4 | 1050056 | 6722 | 0.008 | 0.5148 | No | ||
| 23 | PPL | 2360072 | 6856 | 0.007 | 0.5085 | No | ||
| 24 | CYP24A1 | 2340338 | 8129 | 0.003 | 0.4404 | No | ||
| 25 | PHF16 | 50373 7200161 | 8620 | 0.002 | 0.4143 | No | ||
| 26 | SAA1 | 5390520 | 8800 | 0.001 | 0.4048 | No | ||
| 27 | ANGPT1 | 3990368 5130288 6770035 | 9728 | -0.001 | 0.3550 | No | ||
| 28 | SERPINE1 | 4210403 | 11015 | -0.005 | 0.2863 | No | ||
| 29 | KCNJ2 | 630019 | 11058 | -0.005 | 0.2846 | No | ||
| 30 | HOXA5 | 6840026 | 11121 | -0.005 | 0.2818 | No | ||
| 31 | CLDN10 | 4070364 4590059 4920097 5080687 6620270 | 11409 | -0.006 | 0.2671 | No | ||
| 32 | DBH | 3610458 | 12151 | -0.009 | 0.2282 | No | ||
| 33 | PITX2 | 870537 2690139 | 12585 | -0.011 | 0.2062 | No | ||
| 34 | IL19 | 6040142 | 12648 | -0.011 | 0.2041 | No | ||
| 35 | FGF14 | 2630390 3520075 6770048 | 13221 | -0.015 | 0.1751 | No | ||
| 36 | NRP2 | 4070400 5860041 6650446 | 13444 | -0.017 | 0.1651 | No | ||
| 37 | SOX10 | 6200538 | 14209 | -0.025 | 0.1269 | No | ||
| 38 | GSR | 3520079 | 14782 | -0.035 | 0.1003 | No | ||
| 39 | WNT5A | 840685 3120152 | 14967 | -0.039 | 0.0950 | No | ||
| 40 | BMF | 610102 | 15356 | -0.051 | 0.0802 | No | ||
| 41 | CUEDC1 | 1660463 | 16421 | -0.106 | 0.0355 | No | ||
| 42 | B4GALT1 | 6980167 | 16501 | -0.113 | 0.0447 | No | ||
| 43 | ITPR3 | 4010632 | 17074 | -0.165 | 0.0335 | No | ||
| 44 | MSH5 | 1340019 4730333 | 18092 | -0.417 | 0.0282 | No |