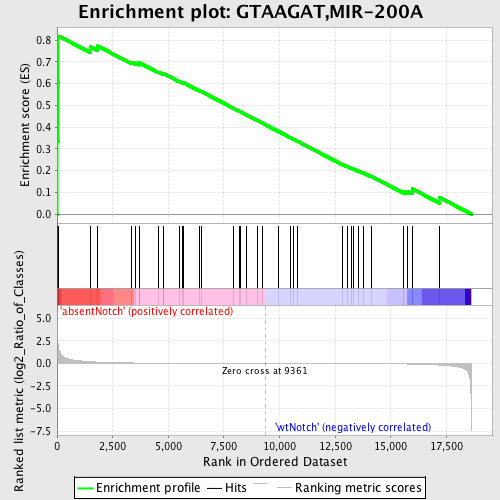
Profile of the Running ES Score & Positions of GeneSet Members on the Rank Ordered List
| Dataset | Set_03_absentNotch_versus_wtNotch.phenotype_absentNotch_versus_wtNotch.cls #absentNotch_versus_wtNotch.phenotype_absentNotch_versus_wtNotch.cls #absentNotch_versus_wtNotch_repos |
| Phenotype | phenotype_absentNotch_versus_wtNotch.cls#absentNotch_versus_wtNotch_repos |
| Upregulated in class | absentNotch |
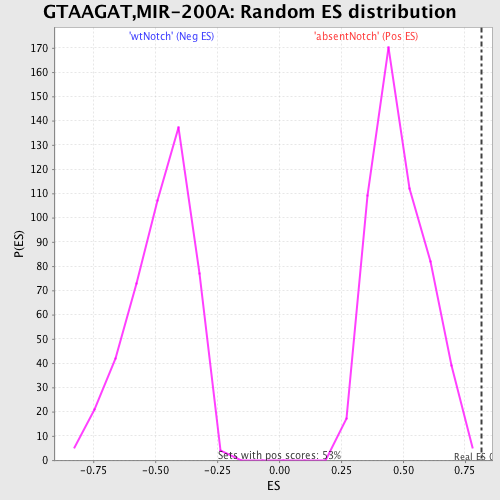
| GeneSet | GTAAGAT,MIR-200A |
| Enrichment Score (ES) | 0.81847674 |
| Normalized Enrichment Score (NES) | 1.6894457 |
| Nominal p-value | 0.0018726592 |
| FDR q-value | 0.075032204 |
| FWER p-Value | 0.111 |
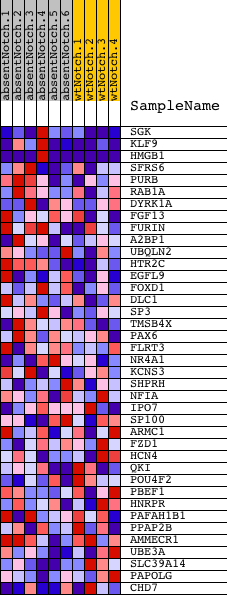
| PROBE | DESCRIPTION (from dataset) | GENE SYMBOL | GENE_TITLE | RANK IN GENE LIST | RANK METRIC SCORE | RUNNING ES | CORE ENRICHMENT | |
|---|---|---|---|---|---|---|---|---|
| 1 | SGK | 1400131 2480056 | 32 | 2.307 | 0.3335 | Yes | ||
| 2 | KLF9 | 3840022 | 48 | 1.890 | 0.6073 | Yes | ||
| 3 | HMGB1 | 2120670 2350044 | 80 | 1.465 | 0.8185 | Yes | ||
| 4 | SFRS6 | 60224 | 1483 | 0.189 | 0.7704 | No | ||
| 5 | PURB | 5360138 | 1821 | 0.144 | 0.7732 | No | ||
| 6 | RAB1A | 2370671 | 3352 | 0.046 | 0.6975 | No | ||
| 7 | DYRK1A | 3190181 | 3512 | 0.042 | 0.6951 | No | ||
| 8 | FGF13 | 630575 1570440 5360121 | 3690 | 0.037 | 0.6909 | No | ||
| 9 | FURIN | 4120168 | 3692 | 0.037 | 0.6963 | No | ||
| 10 | A2BP1 | 2370390 4590593 5550014 | 4557 | 0.022 | 0.6530 | No | ||
| 11 | UBQLN2 | 430397 1170594 4070121 | 4759 | 0.020 | 0.6451 | No | ||
| 12 | HTR2C | 380497 | 4799 | 0.020 | 0.6458 | No | ||
| 13 | EGFL9 | 1410091 | 5482 | 0.014 | 0.6112 | No | ||
| 14 | FOXD1 | 6860053 | 5646 | 0.013 | 0.6043 | No | ||
| 15 | DLC1 | 1090632 6450594 | 5698 | 0.013 | 0.6034 | No | ||
| 16 | SP3 | 3840338 | 6417 | 0.009 | 0.5661 | No | ||
| 17 | TMSB4X | 6620114 | 6467 | 0.009 | 0.5648 | No | ||
| 18 | PAX6 | 1190025 | 7927 | 0.004 | 0.4868 | No | ||
| 19 | FLRT3 | 70685 2760497 6040519 | 8214 | 0.003 | 0.4718 | No | ||
| 20 | NR4A1 | 6290161 | 8225 | 0.003 | 0.4717 | No | ||
| 21 | KCNS3 | 4150039 | 8530 | 0.002 | 0.4557 | No | ||
| 22 | SHPRH | 3990458 | 8989 | 0.001 | 0.4312 | No | ||
| 23 | NFIA | 2760129 5860278 | 9224 | 0.000 | 0.4186 | No | ||
| 24 | IPO7 | 2190746 | 9931 | -0.001 | 0.3808 | No | ||
| 25 | SP100 | 3440632 | 10501 | -0.003 | 0.3506 | No | ||
| 26 | ARMC1 | 5220458 | 10613 | -0.003 | 0.3451 | No | ||
| 27 | FZD1 | 3140215 | 10800 | -0.004 | 0.3357 | No | ||
| 28 | HCN4 | 1050026 | 12830 | -0.012 | 0.2282 | No | ||
| 29 | QKI | 5220093 6130044 | 13044 | -0.014 | 0.2188 | No | ||
| 30 | POU4F2 | 2120195 2570022 | 13229 | -0.015 | 0.2110 | No | ||
| 31 | PBEF1 | 1090278 | 13336 | -0.016 | 0.2076 | No | ||
| 32 | HNRPR | 2320440 2900601 4610008 | 13554 | -0.018 | 0.1985 | No | ||
| 33 | PAFAH1B1 | 4230333 6420121 6450066 | 13768 | -0.020 | 0.1899 | No | ||
| 34 | PPAP2B | 3190397 4730280 | 14112 | -0.024 | 0.1748 | No | ||
| 35 | AMMECR1 | 3800435 | 15575 | -0.059 | 0.1048 | No | ||
| 36 | UBE3A | 1240152 2690438 5860609 | 15758 | -0.067 | 0.1047 | No | ||
| 37 | SLC39A14 | 670300 1400093 1990711 | 15965 | -0.077 | 0.1048 | No | ||
| 38 | PAPOLG | 2470400 | 15970 | -0.077 | 0.1159 | No | ||
| 39 | CHD7 | 3870372 | 17197 | -0.183 | 0.0764 | No |