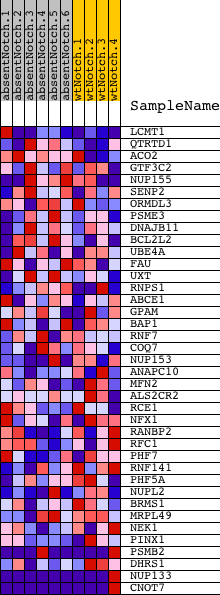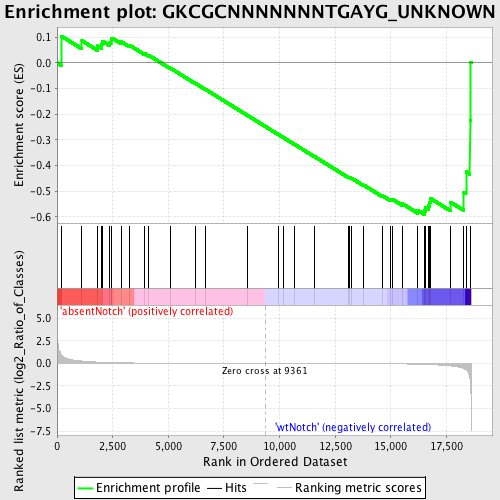
Profile of the Running ES Score & Positions of GeneSet Members on the Rank Ordered List
| Dataset | Set_03_absentNotch_versus_wtNotch.phenotype_absentNotch_versus_wtNotch.cls #absentNotch_versus_wtNotch.phenotype_absentNotch_versus_wtNotch.cls #absentNotch_versus_wtNotch_repos |
| Phenotype | phenotype_absentNotch_versus_wtNotch.cls#absentNotch_versus_wtNotch_repos |
| Upregulated in class | wtNotch |
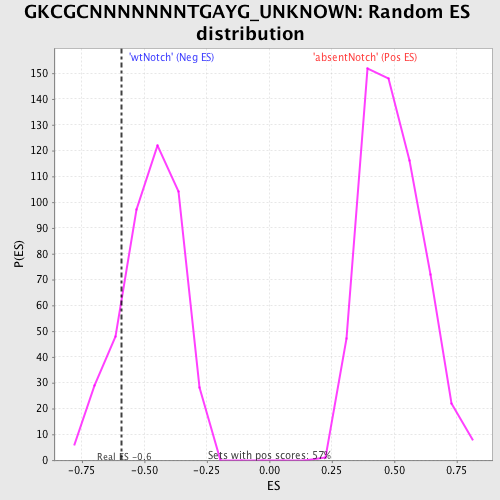
| GeneSet | GKCGCNNNNNNNTGAYG_UNKNOWN |
| Enrichment Score (ES) | -0.59036434 |
| Normalized Enrichment Score (NES) | -1.2418637 |
| Nominal p-value | 0.17511521 |
| FDR q-value | 1.0 |
| FWER p-Value | 1.0 |
| PROBE | DESCRIPTION (from dataset) | GENE SYMBOL | GENE_TITLE | RANK IN GENE LIST | RANK METRIC SCORE | RUNNING ES | CORE ENRICHMENT | |
|---|---|---|---|---|---|---|---|---|
| 1 | LCMT1 | 2230551 3830497 | 191 | 0.927 | 0.1040 | No | ||
| 2 | QTRTD1 | 7000053 | 1114 | 0.258 | 0.0862 | No | ||
| 3 | ACO2 | 4230600 | 1824 | 0.144 | 0.0658 | No | ||
| 4 | GTF3C2 | 670494 | 2002 | 0.125 | 0.0717 | No | ||
| 5 | NUP155 | 5720576 6220114 | 2040 | 0.122 | 0.0847 | No | ||
| 6 | SENP2 | 4540452 | 2374 | 0.096 | 0.0787 | No | ||
| 7 | ORMDL3 | 1340711 | 2424 | 0.093 | 0.0875 | No | ||
| 8 | PSME3 | 2810537 | 2463 | 0.091 | 0.0966 | No | ||
| 9 | DNAJB11 | 4150168 | 2875 | 0.066 | 0.0827 | No | ||
| 10 | BCL2L2 | 2760692 6770739 | 3253 | 0.050 | 0.0686 | No | ||
| 11 | UBE4A | 6100520 | 3946 | 0.031 | 0.0352 | No | ||
| 12 | FAU | 7100465 | 4116 | 0.029 | 0.0296 | No | ||
| 13 | UXT | 110019 5080066 | 5086 | 0.017 | -0.0204 | No | ||
| 14 | RNPS1 | 610736 1090021 | 6217 | 0.010 | -0.0800 | No | ||
| 15 | ABCE1 | 4280050 | 6682 | 0.008 | -0.1040 | No | ||
| 16 | GPAM | 1740180 | 8536 | 0.002 | -0.2035 | No | ||
| 17 | BAP1 | 3830131 | 9953 | -0.002 | -0.2795 | No | ||
| 18 | RNF7 | 2030242 | 10191 | -0.002 | -0.2920 | No | ||
| 19 | COQ7 | 3190632 | 10647 | -0.003 | -0.3161 | No | ||
| 20 | NUP153 | 7000452 | 11575 | -0.006 | -0.3652 | No | ||
| 21 | ANAPC10 | 870086 1170037 2260129 | 13109 | -0.014 | -0.4459 | No | ||
| 22 | MFN2 | 2260195 6100164 | 13124 | -0.014 | -0.4450 | No | ||
| 23 | ALS2CR2 | 6450128 7100092 | 13249 | -0.015 | -0.4498 | No | ||
| 24 | RCE1 | 1980372 | 13774 | -0.020 | -0.4755 | No | ||
| 25 | NFX1 | 450504 | 14641 | -0.032 | -0.5182 | No | ||
| 26 | RANBP2 | 4280338 | 14964 | -0.039 | -0.5307 | No | ||
| 27 | RFC1 | 1190673 | 15057 | -0.042 | -0.5305 | No | ||
| 28 | PHF7 | 1510519 | 15504 | -0.057 | -0.5475 | No | ||
| 29 | RNF141 | 130463 6840041 | 16209 | -0.091 | -0.5742 | No | ||
| 30 | PHF5A | 2690519 | 16511 | -0.114 | -0.5763 | Yes | ||
| 31 | NUPL2 | 6550537 | 16547 | -0.116 | -0.5639 | Yes | ||
| 32 | BRMS1 | 6860280 | 16694 | -0.127 | -0.5561 | Yes | ||
| 33 | MRPL49 | 460541 610162 5340156 | 16734 | -0.131 | -0.5421 | Yes | ||
| 34 | NEK1 | 4570059 | 16779 | -0.135 | -0.5277 | Yes | ||
| 35 | PINX1 | 3360154 | 17675 | -0.275 | -0.5419 | Yes | ||
| 36 | PSMB2 | 940035 4210324 | 18281 | -0.569 | -0.5043 | Yes | ||
| 37 | DHRS1 | 5220673 | 18380 | -0.695 | -0.4239 | Yes | ||
| 38 | NUP133 | 2360168 4760017 | 18558 | -1.686 | -0.2255 | Yes | ||
| 39 | CNOT7 | 2450338 5720397 | 18574 | -1.854 | 0.0023 | Yes |