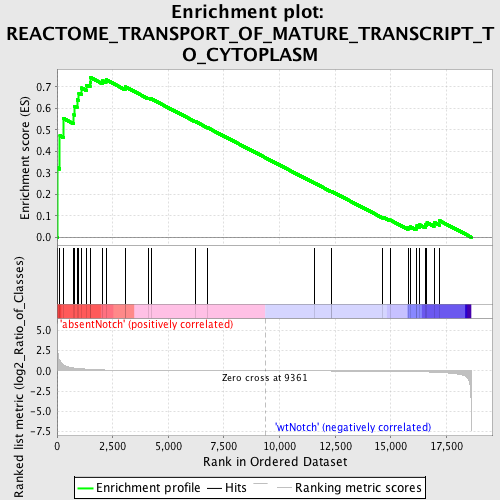
Profile of the Running ES Score & Positions of GeneSet Members on the Rank Ordered List
| Dataset | Set_03_absentNotch_versus_wtNotch.phenotype_absentNotch_versus_wtNotch.cls #absentNotch_versus_wtNotch.phenotype_absentNotch_versus_wtNotch.cls #absentNotch_versus_wtNotch_repos |
| Phenotype | phenotype_absentNotch_versus_wtNotch.cls#absentNotch_versus_wtNotch_repos |
| Upregulated in class | absentNotch |
| GeneSet | REACTOME_TRANSPORT_OF_MATURE_TRANSCRIPT_TO_CYTOPLASM |
| Enrichment Score (ES) | 0.74303764 |
| Normalized Enrichment Score (NES) | 1.4706391 |
| Nominal p-value | 0.028142588 |
| FDR q-value | 1.0 |
| FWER p-Value | 1.0 |

| PROBE | DESCRIPTION (from dataset) | GENE SYMBOL | GENE_TITLE | RANK IN GENE LIST | RANK METRIC SCORE | RUNNING ES | CORE ENRICHMENT | |
|---|---|---|---|---|---|---|---|---|
| 1 | SFRS2 | 50707 380593 | 22 | 2.749 | 0.3228 | Yes | ||
| 2 | U2AF2 | 450600 4670128 5420292 | 127 | 1.321 | 0.4729 | Yes | ||
| 3 | THOC4 | 3800731 6400114 | 282 | 0.744 | 0.5524 | Yes | ||
| 4 | NUP107 | 6380021 | 754 | 0.358 | 0.5693 | Yes | ||
| 5 | NUP43 | 3360482 | 767 | 0.355 | 0.6105 | Yes | ||
| 6 | SFRS1 | 2360440 | 898 | 0.313 | 0.6404 | Yes | ||
| 7 | MAGOH | 2370373 5050068 | 978 | 0.289 | 0.6701 | Yes | ||
| 8 | SFRS5 | 3450176 6350008 | 1094 | 0.262 | 0.6948 | Yes | ||
| 9 | SRRM1 | 6110025 | 1326 | 0.219 | 0.7081 | Yes | ||
| 10 | SFRS6 | 60224 | 1483 | 0.189 | 0.7220 | Yes | ||
| 11 | NUP62 | 1240128 | 1501 | 0.186 | 0.7430 | Yes | ||
| 12 | NUP155 | 5720576 6220114 | 2040 | 0.122 | 0.7285 | No | ||
| 13 | EIF4E | 1580403 70133 6380215 | 2199 | 0.109 | 0.7328 | No | ||
| 14 | NUP37 | 2370097 6370435 6380008 | 3061 | 0.058 | 0.6933 | No | ||
| 15 | NUP93 | 2190273 | 3067 | 0.058 | 0.6998 | No | ||
| 16 | NUP188 | 1190470 | 4094 | 0.029 | 0.6480 | No | ||
| 17 | RAE1 | 7050121 | 4221 | 0.027 | 0.6444 | No | ||
| 18 | RNPS1 | 610736 1090021 | 6217 | 0.010 | 0.5382 | No | ||
| 19 | TPR | 1990066 6550390 | 6776 | 0.008 | 0.5091 | No | ||
| 20 | NUP153 | 7000452 | 11575 | -0.006 | 0.2517 | No | ||
| 21 | SLBP | 6220601 | 12314 | -0.009 | 0.2131 | No | ||
| 22 | NUP35 | 5340408 | 12329 | -0.009 | 0.2135 | No | ||
| 23 | NFX1 | 450504 | 14641 | -0.032 | 0.0929 | No | ||
| 24 | RANBP2 | 4280338 | 14964 | -0.039 | 0.0802 | No | ||
| 25 | CPSF1 | 6290064 | 15776 | -0.068 | 0.0446 | No | ||
| 26 | NUP54 | 940546 2360156 4060278 | 15874 | -0.073 | 0.0479 | No | ||
| 27 | SFRS3 | 770315 4230593 | 16137 | -0.087 | 0.0441 | No | ||
| 28 | NUP160 | 1990551 | 16173 | -0.089 | 0.0527 | No | ||
| 29 | U2AF1 | 5130292 | 16304 | -0.098 | 0.0573 | No | ||
| 30 | NUPL2 | 6550537 | 16547 | -0.116 | 0.0579 | No | ||
| 31 | SFRS7 | 2760408 | 16625 | -0.121 | 0.0681 | No | ||
| 32 | SFRS9 | 3800047 | 16944 | -0.151 | 0.0687 | No | ||
| 33 | NCBP2 | 5340500 | 17177 | -0.180 | 0.0774 | No |

