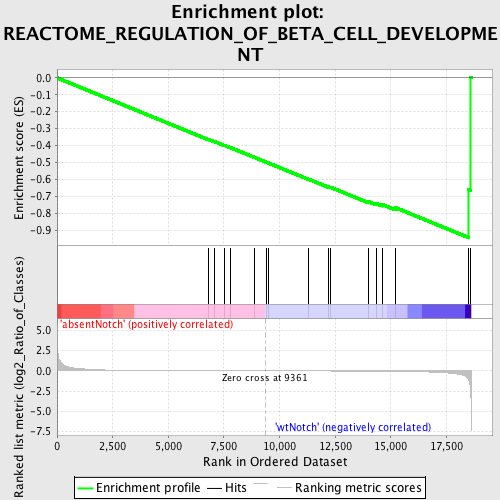
Profile of the Running ES Score & Positions of GeneSet Members on the Rank Ordered List
| Dataset | Set_03_absentNotch_versus_wtNotch.phenotype_absentNotch_versus_wtNotch.cls #absentNotch_versus_wtNotch.phenotype_absentNotch_versus_wtNotch.cls #absentNotch_versus_wtNotch_repos |
| Phenotype | phenotype_absentNotch_versus_wtNotch.cls#absentNotch_versus_wtNotch_repos |
| Upregulated in class | wtNotch |
| GeneSet | REACTOME_REGULATION_OF_BETA_CELL_DEVELOPMENT |
| Enrichment Score (ES) | -0.94272894 |
| Normalized Enrichment Score (NES) | -1.6978414 |
| Nominal p-value | 0.0 |
| FDR q-value | 0.03565139 |
| FWER p-Value | 0.359 |
| PROBE | DESCRIPTION (from dataset) | GENE SYMBOL | GENE_TITLE | RANK IN GENE LIST | RANK METRIC SCORE | RUNNING ES | CORE ENRICHMENT | |
|---|---|---|---|---|---|---|---|---|
| 1 | PDX1 | 6660647 | 6822 | 0.007 | -0.3646 | No | ||
| 2 | ONECUT3 | 5720487 6100037 | 7084 | 0.006 | -0.3768 | No | ||
| 3 | NKX2-2 | 4150731 | 7530 | 0.005 | -0.3993 | No | ||
| 4 | FOXA3 | 2680121 | 7782 | 0.004 | -0.4116 | No | ||
| 5 | HNF4G | 5720451 | 8864 | 0.001 | -0.4693 | No | ||
| 6 | FGF10 | 730458 840706 | 9415 | -0.000 | -0.4989 | No | ||
| 7 | AKT1 | 5290746 | 9501 | -0.000 | -0.5033 | No | ||
| 8 | NKX6-1 | 6040731 | 11297 | -0.005 | -0.5983 | No | ||
| 9 | INSM1 | 3450671 | 12178 | -0.009 | -0.6431 | No | ||
| 10 | PAX4 | 6620619 | 12291 | -0.009 | -0.6464 | No | ||
| 11 | IAPP | 4230040 | 13996 | -0.022 | -0.7317 | No | ||
| 12 | NEUROD1 | 3060619 | 14357 | -0.027 | -0.7433 | No | ||
| 13 | PTF1A | 6450377 | 14612 | -0.032 | -0.7479 | No | ||
| 14 | SLC2A2 | 5130537 5720722 6770079 | 15197 | -0.046 | -0.7662 | Yes | ||
| 15 | HES1 | 4810280 | 18482 | -0.988 | -0.6598 | Yes | ||
| 16 | NOTCH1 | 3390114 | 18588 | -2.330 | 0.0015 | Yes |

