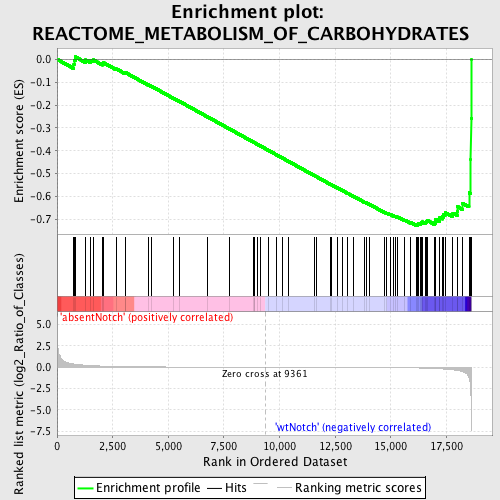
Profile of the Running ES Score & Positions of GeneSet Members on the Rank Ordered List
| Dataset | Set_03_absentNotch_versus_wtNotch.phenotype_absentNotch_versus_wtNotch.cls #absentNotch_versus_wtNotch.phenotype_absentNotch_versus_wtNotch.cls #absentNotch_versus_wtNotch_repos |
| Phenotype | phenotype_absentNotch_versus_wtNotch.cls#absentNotch_versus_wtNotch_repos |
| Upregulated in class | wtNotch |
| GeneSet | REACTOME_METABOLISM_OF_CARBOHYDRATES |
| Enrichment Score (ES) | -0.72895956 |
| Normalized Enrichment Score (NES) | -1.6665529 |
| Nominal p-value | 0.004901961 |
| FDR q-value | 0.06294155 |
| FWER p-Value | 0.592 |
| PROBE | DESCRIPTION (from dataset) | GENE SYMBOL | GENE_TITLE | RANK IN GENE LIST | RANK METRIC SCORE | RUNNING ES | CORE ENRICHMENT | |
|---|---|---|---|---|---|---|---|---|
| 1 | NUP107 | 6380021 | 754 | 0.358 | -0.0220 | No | ||
| 2 | NUP43 | 3360482 | 767 | 0.355 | -0.0041 | No | ||
| 3 | GYG1 | 460746 1450138 | 815 | 0.336 | 0.0108 | No | ||
| 4 | SLC2A1 | 2100609 | 1282 | 0.224 | -0.0026 | No | ||
| 5 | NUP62 | 1240128 | 1501 | 0.186 | -0.0047 | No | ||
| 6 | GALK1 | 840162 | 1624 | 0.167 | -0.0025 | No | ||
| 7 | NUP155 | 5720576 6220114 | 2040 | 0.122 | -0.0186 | No | ||
| 8 | PYGL | 7160520 | 2096 | 0.118 | -0.0154 | No | ||
| 9 | G6PC | 430093 | 2666 | 0.077 | -0.0420 | No | ||
| 10 | NUP37 | 2370097 6370435 6380008 | 3061 | 0.058 | -0.0603 | No | ||
| 11 | NUP93 | 2190273 | 3067 | 0.058 | -0.0575 | No | ||
| 12 | NUP188 | 1190470 | 4094 | 0.029 | -0.1113 | No | ||
| 13 | RAE1 | 7050121 | 4221 | 0.027 | -0.1167 | No | ||
| 14 | PYGM | 3940300 | 5228 | 0.016 | -0.1701 | No | ||
| 15 | CALM1 | 380128 | 5487 | 0.014 | -0.1833 | No | ||
| 16 | TPR | 1990066 6550390 | 6776 | 0.008 | -0.2524 | No | ||
| 17 | SLC2A4 | 540441 | 7754 | 0.004 | -0.3048 | No | ||
| 18 | GCKR | 4070035 | 8829 | 0.001 | -0.3627 | No | ||
| 19 | GYS2 | 2570736 | 8876 | 0.001 | -0.3651 | No | ||
| 20 | SLC5A1 | 2470053 | 8882 | 0.001 | -0.3653 | No | ||
| 21 | PDHB | 70215 610086 | 9006 | 0.001 | -0.3719 | No | ||
| 22 | PFKFB1 | 2370128 | 9121 | 0.001 | -0.3780 | No | ||
| 23 | GBE1 | 2190368 | 9487 | -0.000 | -0.3976 | No | ||
| 24 | PHKG1 | 2570152 | 9853 | -0.001 | -0.4173 | No | ||
| 25 | AMY2A | 580138 | 10140 | -0.002 | -0.4326 | No | ||
| 26 | PDHX | 870315 | 10398 | -0.003 | -0.4463 | No | ||
| 27 | NUP153 | 7000452 | 11575 | -0.006 | -0.5093 | No | ||
| 28 | PGM1 | 3840408 | 11642 | -0.007 | -0.5126 | No | ||
| 29 | SLC2A5 | 670273 | 12308 | -0.009 | -0.5479 | No | ||
| 30 | NUP35 | 5340408 | 12329 | -0.009 | -0.5485 | No | ||
| 31 | MDH2 | 1850601 | 12591 | -0.011 | -0.5620 | No | ||
| 32 | MDH1 | 6660358 6760731 | 12846 | -0.012 | -0.5751 | No | ||
| 33 | TREH | 630079 | 13059 | -0.014 | -0.5858 | No | ||
| 34 | GYS1 | 540154 | 13314 | -0.016 | -0.5987 | No | ||
| 35 | FBP2 | 1580193 | 13817 | -0.020 | -0.6247 | No | ||
| 36 | PCK1 | 7000358 | 13885 | -0.021 | -0.6272 | No | ||
| 37 | RPIA | 780079 | 14023 | -0.023 | -0.6334 | No | ||
| 38 | DLAT | 430452 | 14734 | -0.034 | -0.6699 | No | ||
| 39 | TKT | 6590064 6860039 | 14821 | -0.036 | -0.6727 | No | ||
| 40 | RANBP2 | 4280338 | 14964 | -0.039 | -0.6783 | No | ||
| 41 | HK1 | 4280402 | 15118 | -0.043 | -0.6843 | No | ||
| 42 | SLC2A2 | 5130537 5720722 6770079 | 15197 | -0.046 | -0.6861 | No | ||
| 43 | PDHA1 | 5550397 | 15310 | -0.050 | -0.6896 | No | ||
| 44 | TALDO1 | 940400 | 15629 | -0.061 | -0.7035 | No | ||
| 45 | NUP54 | 940546 2360156 4060278 | 15874 | -0.073 | -0.7129 | No | ||
| 46 | NUP160 | 1990551 | 16173 | -0.089 | -0.7243 | Yes | ||
| 47 | SI | 730167 2260609 | 16201 | -0.091 | -0.7210 | Yes | ||
| 48 | DLD | 4150403 6590341 | 16231 | -0.092 | -0.7178 | Yes | ||
| 49 | HK3 | 3190288 6510142 | 16325 | -0.099 | -0.7177 | Yes | ||
| 50 | SLC25A1 | 4050402 | 16375 | -0.103 | -0.7150 | Yes | ||
| 51 | PFKFB2 | 3940538 7100059 | 16410 | -0.106 | -0.7113 | Yes | ||
| 52 | NUPL2 | 6550537 | 16547 | -0.116 | -0.7126 | Yes | ||
| 53 | GALE | 3610400 6290072 | 16590 | -0.119 | -0.7087 | Yes | ||
| 54 | MGAM | 2510438 | 16640 | -0.122 | -0.7049 | Yes | ||
| 55 | GOT1 | 2940465 | 16955 | -0.152 | -0.7139 | Yes | ||
| 56 | PGD | 6840048 | 17004 | -0.158 | -0.7083 | Yes | ||
| 57 | PFKFB3 | 630706 | 17014 | -0.158 | -0.7005 | Yes | ||
| 58 | SLC25A11 | 130097 770685 | 17180 | -0.180 | -0.7001 | Yes | ||
| 59 | PRPS1 | 6350129 | 17203 | -0.183 | -0.6917 | Yes | ||
| 60 | PHKG2 | 2640148 | 17331 | -0.208 | -0.6877 | Yes | ||
| 61 | KHK | 1090204 3870204 | 17377 | -0.216 | -0.6788 | Yes | ||
| 62 | PGLS | 2120324 | 17439 | -0.228 | -0.6702 | Yes | ||
| 63 | SLC2A3 | 1990377 | 17788 | -0.309 | -0.6729 | Yes | ||
| 64 | PHKA2 | 610035 1090044 | 17982 | -0.377 | -0.6637 | Yes | ||
| 65 | GALT | 3710162 5550075 | 17999 | -0.383 | -0.6445 | Yes | ||
| 66 | PKM2 | 6520403 70500 | 18229 | -0.514 | -0.6301 | Yes | ||
| 67 | TPI1 | 1500215 2100154 | 18514 | -1.197 | -0.5830 | Yes | ||
| 68 | BSG | 2900193 6520053 | 18598 | -2.901 | -0.4364 | Yes | ||
| 69 | GOT2 | 4570164 5220450 | 18603 | -3.412 | -0.2589 | Yes | ||
| 70 | PGK1 | 1570494 630300 | 18612 | -4.983 | 0.0002 | Yes |

