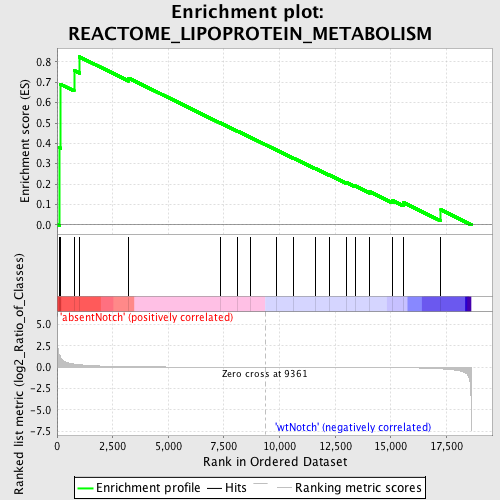
Profile of the Running ES Score & Positions of GeneSet Members on the Rank Ordered List
| Dataset | Set_03_absentNotch_versus_wtNotch.phenotype_absentNotch_versus_wtNotch.cls #absentNotch_versus_wtNotch.phenotype_absentNotch_versus_wtNotch.cls #absentNotch_versus_wtNotch_repos |
| Phenotype | phenotype_absentNotch_versus_wtNotch.cls#absentNotch_versus_wtNotch_repos |
| Upregulated in class | absentNotch |
| GeneSet | REACTOME_LIPOPROTEIN_METABOLISM |
| Enrichment Score (ES) | 0.825038 |
| Normalized Enrichment Score (NES) | 1.4973757 |
| Nominal p-value | 0.03088803 |
| FDR q-value | 1.0 |
| FWER p-Value | 1.0 |
| PROBE | DESCRIPTION (from dataset) | GENE SYMBOL | GENE_TITLE | RANK IN GENE LIST | RANK METRIC SCORE | RUNNING ES | CORE ENRICHMENT | |
|---|---|---|---|---|---|---|---|---|
| 1 | APOE | 4200671 | 110 | 1.361 | 0.3783 | Yes | ||
| 2 | HSPG2 | 2510687 6220750 | 158 | 1.113 | 0.6900 | Yes | ||
| 3 | MTTP | 3780161 | 763 | 0.356 | 0.7580 | Yes | ||
| 4 | P4HB | 6110056 | 1003 | 0.283 | 0.8250 | Yes | ||
| 5 | APOA1 | 110152 | 3217 | 0.052 | 0.7206 | No | ||
| 6 | LCAT | 6400441 | 7339 | 0.006 | 0.5006 | No | ||
| 7 | ABCA1 | 6290156 | 8101 | 0.003 | 0.4606 | No | ||
| 8 | CUBN | 630338 | 8682 | 0.002 | 0.4300 | No | ||
| 9 | APOA5 | 6130471 | 9858 | -0.001 | 0.3671 | No | ||
| 10 | APOA2 | 6510364 6860411 | 10636 | -0.003 | 0.3263 | No | ||
| 11 | APOC3 | 2030168 | 11600 | -0.007 | 0.2764 | No | ||
| 12 | A2M | 6620039 | 12238 | -0.009 | 0.2447 | No | ||
| 13 | APOA4 | 4120451 | 13004 | -0.013 | 0.2073 | No | ||
| 14 | LIPC | 2690497 | 13396 | -0.016 | 0.1909 | No | ||
| 15 | APOB | 2370672 | 14052 | -0.023 | 0.1621 | No | ||
| 16 | LDLR | 5670386 | 15067 | -0.042 | 0.1194 | No | ||
| 17 | APOC2 | 50100 | 15562 | -0.059 | 0.1095 | No | ||
| 18 | LPL | 1450735 2970706 | 17251 | -0.194 | 0.0734 | No |

