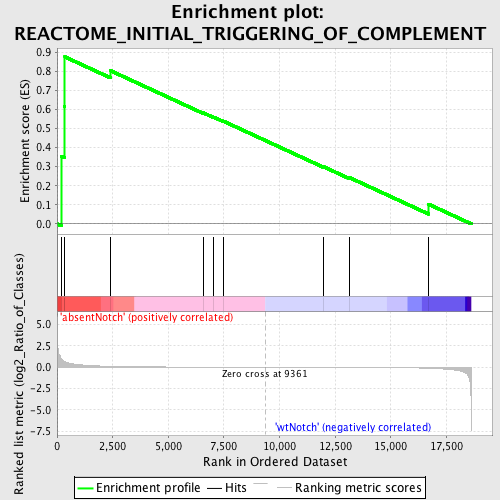
Profile of the Running ES Score & Positions of GeneSet Members on the Rank Ordered List
| Dataset | Set_03_absentNotch_versus_wtNotch.phenotype_absentNotch_versus_wtNotch.cls #absentNotch_versus_wtNotch.phenotype_absentNotch_versus_wtNotch.cls #absentNotch_versus_wtNotch_repos |
| Phenotype | phenotype_absentNotch_versus_wtNotch.cls#absentNotch_versus_wtNotch_repos |
| Upregulated in class | absentNotch |
| GeneSet | REACTOME_INITIAL_TRIGGERING_OF_COMPLEMENT |
| Enrichment Score (ES) | 0.8751507 |
| Normalized Enrichment Score (NES) | 1.4464756 |
| Nominal p-value | 0.03726708 |
| FDR q-value | 1.0 |
| FWER p-Value | 1.0 |
| PROBE | DESCRIPTION (from dataset) | GENE SYMBOL | GENE_TITLE | RANK IN GENE LIST | RANK METRIC SCORE | RUNNING ES | CORE ENRICHMENT | |
|---|---|---|---|---|---|---|---|---|
| 1 | C1QC | 5700131 | 200 | 0.905 | 0.3533 | Yes | ||
| 2 | C1QB | 5910292 | 328 | 0.670 | 0.6161 | Yes | ||
| 3 | C1QA | 5390687 | 348 | 0.647 | 0.8752 | Yes | ||
| 4 | C3 | 1740372 | 2408 | 0.094 | 0.8022 | No | ||
| 5 | C1R | 2340025 3290152 4850452 | 6570 | 0.008 | 0.5820 | No | ||
| 6 | MASP1 | 1780619 2900066 | 7041 | 0.007 | 0.5594 | No | ||
| 7 | CFD | 2320736 | 7466 | 0.005 | 0.5387 | No | ||
| 8 | MBL2 | 6370446 | 11983 | -0.008 | 0.2992 | No | ||
| 9 | C1S | 840184 6840114 | 13148 | -0.014 | 0.2424 | No | ||
| 10 | C2 | 5390465 | 16698 | -0.128 | 0.1031 | No |

