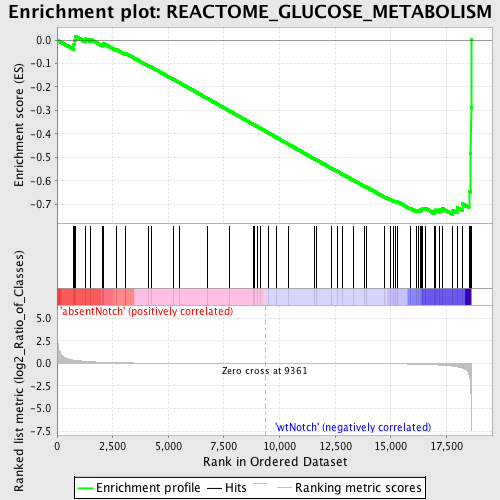
Profile of the Running ES Score & Positions of GeneSet Members on the Rank Ordered List
| Dataset | Set_03_absentNotch_versus_wtNotch.phenotype_absentNotch_versus_wtNotch.cls #absentNotch_versus_wtNotch.phenotype_absentNotch_versus_wtNotch.cls #absentNotch_versus_wtNotch_repos |
| Phenotype | phenotype_absentNotch_versus_wtNotch.cls#absentNotch_versus_wtNotch_repos |
| Upregulated in class | wtNotch |
| GeneSet | REACTOME_GLUCOSE_METABOLISM |
| Enrichment Score (ES) | -0.74342775 |
| Normalized Enrichment Score (NES) | -1.6528195 |
| Nominal p-value | 0.0 |
| FDR q-value | 0.06898611 |
| FWER p-Value | 0.691 |
| PROBE | DESCRIPTION (from dataset) | GENE SYMBOL | GENE_TITLE | RANK IN GENE LIST | RANK METRIC SCORE | RUNNING ES | CORE ENRICHMENT | |
|---|---|---|---|---|---|---|---|---|
| 1 | NUP107 | 6380021 | 754 | 0.358 | -0.0200 | No | ||
| 2 | NUP43 | 3360482 | 767 | 0.355 | -0.0002 | No | ||
| 3 | GYG1 | 460746 1450138 | 815 | 0.336 | 0.0166 | No | ||
| 4 | SLC2A1 | 2100609 | 1282 | 0.224 | 0.0044 | No | ||
| 5 | NUP62 | 1240128 | 1501 | 0.186 | 0.0033 | No | ||
| 6 | NUP155 | 5720576 6220114 | 2040 | 0.122 | -0.0186 | No | ||
| 7 | PYGL | 7160520 | 2096 | 0.118 | -0.0148 | No | ||
| 8 | G6PC | 430093 | 2666 | 0.077 | -0.0410 | No | ||
| 9 | NUP37 | 2370097 6370435 6380008 | 3061 | 0.058 | -0.0589 | No | ||
| 10 | NUP93 | 2190273 | 3067 | 0.058 | -0.0559 | No | ||
| 11 | NUP188 | 1190470 | 4094 | 0.029 | -0.1095 | No | ||
| 12 | RAE1 | 7050121 | 4221 | 0.027 | -0.1147 | No | ||
| 13 | PYGM | 3940300 | 5228 | 0.016 | -0.1680 | No | ||
| 14 | CALM1 | 380128 | 5487 | 0.014 | -0.1811 | No | ||
| 15 | TPR | 1990066 6550390 | 6776 | 0.008 | -0.2500 | No | ||
| 16 | SLC2A4 | 540441 | 7754 | 0.004 | -0.3024 | No | ||
| 17 | GCKR | 4070035 | 8829 | 0.001 | -0.3602 | No | ||
| 18 | GYS2 | 2570736 | 8876 | 0.001 | -0.3626 | No | ||
| 19 | PDHB | 70215 610086 | 9006 | 0.001 | -0.3695 | No | ||
| 20 | PFKFB1 | 2370128 | 9121 | 0.001 | -0.3756 | No | ||
| 21 | GBE1 | 2190368 | 9487 | -0.000 | -0.3952 | No | ||
| 22 | PHKG1 | 2570152 | 9853 | -0.001 | -0.4148 | No | ||
| 23 | PDHX | 870315 | 10398 | -0.003 | -0.4440 | No | ||
| 24 | NUP153 | 7000452 | 11575 | -0.006 | -0.5070 | No | ||
| 25 | PGM1 | 3840408 | 11642 | -0.007 | -0.5101 | No | ||
| 26 | NUP35 | 5340408 | 12329 | -0.009 | -0.5465 | No | ||
| 27 | MDH2 | 1850601 | 12591 | -0.011 | -0.5600 | No | ||
| 28 | MDH1 | 6660358 6760731 | 12846 | -0.012 | -0.5730 | No | ||
| 29 | GYS1 | 540154 | 13314 | -0.016 | -0.5972 | No | ||
| 30 | FBP2 | 1580193 | 13817 | -0.020 | -0.6231 | No | ||
| 31 | PCK1 | 7000358 | 13885 | -0.021 | -0.6255 | No | ||
| 32 | DLAT | 430452 | 14734 | -0.034 | -0.6692 | No | ||
| 33 | RANBP2 | 4280338 | 14964 | -0.039 | -0.6793 | No | ||
| 34 | HK1 | 4280402 | 15118 | -0.043 | -0.6850 | No | ||
| 35 | SLC2A2 | 5130537 5720722 6770079 | 15197 | -0.046 | -0.6866 | No | ||
| 36 | PDHA1 | 5550397 | 15310 | -0.050 | -0.6898 | No | ||
| 37 | NUP54 | 940546 2360156 4060278 | 15874 | -0.073 | -0.7159 | No | ||
| 38 | NUP160 | 1990551 | 16173 | -0.089 | -0.7268 | No | ||
| 39 | DLD | 4150403 6590341 | 16231 | -0.092 | -0.7246 | No | ||
| 40 | HK3 | 3190288 6510142 | 16325 | -0.099 | -0.7239 | No | ||
| 41 | SLC25A1 | 4050402 | 16375 | -0.103 | -0.7207 | No | ||
| 42 | PFKFB2 | 3940538 7100059 | 16410 | -0.106 | -0.7164 | No | ||
| 43 | NUPL2 | 6550537 | 16547 | -0.116 | -0.7171 | No | ||
| 44 | GOT1 | 2940465 | 16955 | -0.152 | -0.7302 | Yes | ||
| 45 | PFKFB3 | 630706 | 17014 | -0.158 | -0.7242 | Yes | ||
| 46 | SLC25A11 | 130097 770685 | 17180 | -0.180 | -0.7228 | Yes | ||
| 47 | PHKG2 | 2640148 | 17331 | -0.208 | -0.7189 | Yes | ||
| 48 | SLC2A3 | 1990377 | 17788 | -0.309 | -0.7256 | Yes | ||
| 49 | PHKA2 | 610035 1090044 | 17982 | -0.377 | -0.7143 | Yes | ||
| 50 | PKM2 | 6520403 70500 | 18229 | -0.514 | -0.6980 | Yes | ||
| 51 | TPI1 | 1500215 2100154 | 18514 | -1.197 | -0.6444 | Yes | ||
| 52 | BSG | 2900193 6520053 | 18598 | -2.901 | -0.4820 | Yes | ||
| 53 | GOT2 | 4570164 5220450 | 18603 | -3.412 | -0.2860 | Yes | ||
| 54 | PGK1 | 1570494 630300 | 18612 | -4.983 | 0.0002 | Yes |

