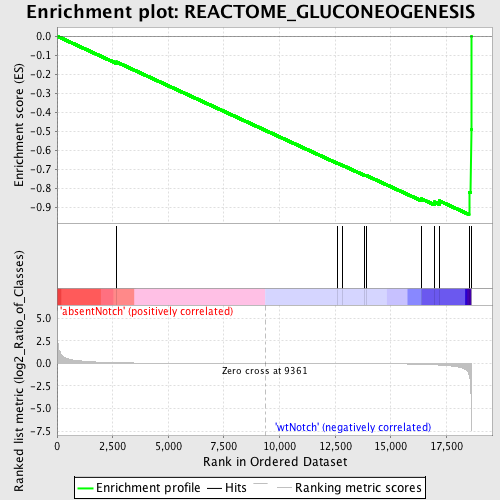
Profile of the Running ES Score & Positions of GeneSet Members on the Rank Ordered List
| Dataset | Set_03_absentNotch_versus_wtNotch.phenotype_absentNotch_versus_wtNotch.cls #absentNotch_versus_wtNotch.phenotype_absentNotch_versus_wtNotch.cls #absentNotch_versus_wtNotch_repos |
| Phenotype | phenotype_absentNotch_versus_wtNotch.cls#absentNotch_versus_wtNotch_repos |
| Upregulated in class | wtNotch |
| GeneSet | REACTOME_GLUCONEOGENESIS |
| Enrichment Score (ES) | -0.93788093 |
| Normalized Enrichment Score (NES) | -1.586354 |
| Nominal p-value | 0.007952286 |
| FDR q-value | 0.17239948 |
| FWER p-Value | 0.97 |
| PROBE | DESCRIPTION (from dataset) | GENE SYMBOL | GENE_TITLE | RANK IN GENE LIST | RANK METRIC SCORE | RUNNING ES | CORE ENRICHMENT | |
|---|---|---|---|---|---|---|---|---|
| 1 | G6PC | 430093 | 2666 | 0.077 | -0.1357 | No | ||
| 2 | MDH2 | 1850601 | 12591 | -0.011 | -0.6680 | No | ||
| 3 | MDH1 | 6660358 6760731 | 12846 | -0.012 | -0.6805 | No | ||
| 4 | FBP2 | 1580193 | 13817 | -0.020 | -0.7306 | No | ||
| 5 | PCK1 | 7000358 | 13885 | -0.021 | -0.7321 | No | ||
| 6 | SLC25A1 | 4050402 | 16375 | -0.103 | -0.8558 | No | ||
| 7 | GOT1 | 2940465 | 16955 | -0.152 | -0.8719 | Yes | ||
| 8 | SLC25A11 | 130097 770685 | 17180 | -0.180 | -0.8662 | Yes | ||
| 9 | TPI1 | 1500215 2100154 | 18514 | -1.197 | -0.8201 | Yes | ||
| 10 | GOT2 | 4570164 5220450 | 18603 | -3.412 | -0.4894 | Yes | ||
| 11 | PGK1 | 1570494 630300 | 18612 | -4.983 | 0.0002 | Yes |

