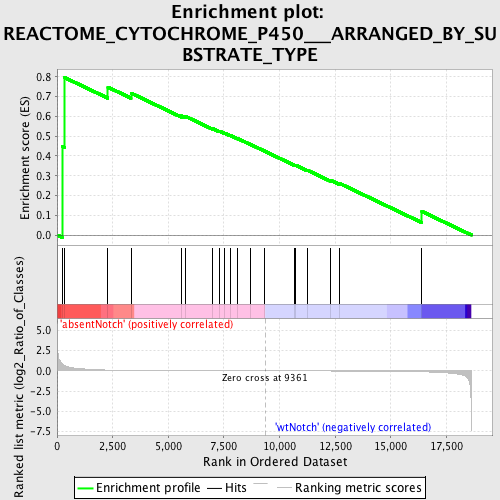
Profile of the Running ES Score & Positions of GeneSet Members on the Rank Ordered List
| Dataset | Set_03_absentNotch_versus_wtNotch.phenotype_absentNotch_versus_wtNotch.cls #absentNotch_versus_wtNotch.phenotype_absentNotch_versus_wtNotch.cls #absentNotch_versus_wtNotch_repos |
| Phenotype | phenotype_absentNotch_versus_wtNotch.cls#absentNotch_versus_wtNotch_repos |
| Upregulated in class | absentNotch |
| GeneSet | REACTOME_CYTOCHROME_P450___ARRANGED_BY_SUBSTRATE_TYPE |
| Enrichment Score (ES) | 0.7966911 |
| Normalized Enrichment Score (NES) | 1.4746312 |
| Nominal p-value | 0.024539877 |
| FDR q-value | 1.0 |
| FWER p-Value | 1.0 |
| PROBE | DESCRIPTION (from dataset) | GENE SYMBOL | GENE_TITLE | RANK IN GENE LIST | RANK METRIC SCORE | RUNNING ES | CORE ENRICHMENT | |
|---|---|---|---|---|---|---|---|---|
| 1 | CYP1B1 | 4760735 | 229 | 0.849 | 0.4486 | Yes | ||
| 2 | TBXAS1 | 5050053 6900286 | 343 | 0.653 | 0.7967 | Yes | ||
| 3 | CYP51A1 | 4590427 | 2285 | 0.103 | 0.7482 | No | ||
| 4 | CYP27A1 | 4050195 5220035 | 3322 | 0.047 | 0.7182 | No | ||
| 5 | CYP19A1 | 1850435 | 5603 | 0.013 | 0.6028 | No | ||
| 6 | CYP17A1 | 1340408 | 5757 | 0.012 | 0.6014 | No | ||
| 7 | CYP2E1 | 4480209 | 6987 | 0.007 | 0.5390 | No | ||
| 8 | CYP4B1 | 2570139 | 7284 | 0.006 | 0.5262 | No | ||
| 9 | CYP7B1 | 1190309 | 7544 | 0.005 | 0.5150 | No | ||
| 10 | CYP11A1 | 3450037 | 7781 | 0.004 | 0.5046 | No | ||
| 11 | CYP24A1 | 2340338 | 8129 | 0.003 | 0.4877 | No | ||
| 12 | CYP7A1 | 6980603 | 8706 | 0.002 | 0.4577 | No | ||
| 13 | CYP2R1 | 2360010 | 9340 | 0.000 | 0.4237 | No | ||
| 14 | CYP1A1 | 4230113 | 10676 | -0.004 | 0.3538 | No | ||
| 15 | CYP1A2 | 5050484 | 10735 | -0.004 | 0.3527 | No | ||
| 16 | CYP27B1 | 5270114 5360010 | 11262 | -0.005 | 0.3273 | No | ||
| 17 | CYP26A1 | 380022 2690600 | 12274 | -0.009 | 0.2780 | No | ||
| 18 | CYP11B2 | 5340129 | 12677 | -0.011 | 0.2624 | No | ||
| 19 | PTGIS | 6620411 | 16396 | -0.105 | 0.1194 | No |

