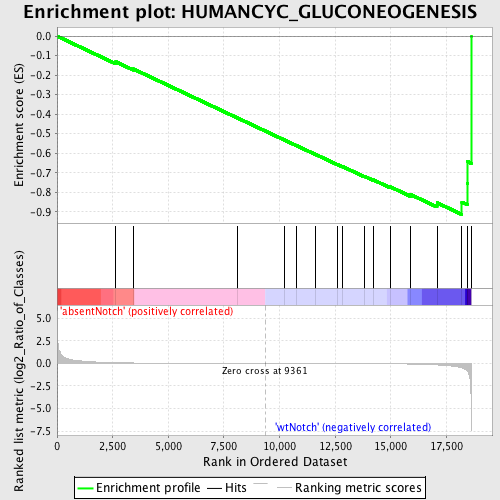
Profile of the Running ES Score & Positions of GeneSet Members on the Rank Ordered List
| Dataset | Set_03_absentNotch_versus_wtNotch.phenotype_absentNotch_versus_wtNotch.cls #absentNotch_versus_wtNotch.phenotype_absentNotch_versus_wtNotch.cls #absentNotch_versus_wtNotch_repos |
| Phenotype | phenotype_absentNotch_versus_wtNotch.cls#absentNotch_versus_wtNotch_repos |
| Upregulated in class | wtNotch |
| GeneSet | HUMANCYC_GLUCONEOGENESIS |
| Enrichment Score (ES) | -0.9140738 |
| Normalized Enrichment Score (NES) | -1.651352 |
| Nominal p-value | 0.0 |
| FDR q-value | 0.06541398 |
| FWER p-Value | 0.704 |
| PROBE | DESCRIPTION (from dataset) | GENE SYMBOL | GENE_TITLE | RANK IN GENE LIST | RANK METRIC SCORE | RUNNING ES | CORE ENRICHMENT | |
|---|---|---|---|---|---|---|---|---|
| 1 | ME2 | 5080121 | 2641 | 0.079 | -0.1317 | No | ||
| 2 | ALDOC | 450121 610427 | 3427 | 0.044 | -0.1681 | No | ||
| 3 | ALDOB | 4730324 | 8087 | 0.003 | -0.4182 | No | ||
| 4 | GAPDHS | 2690463 | 10198 | -0.002 | -0.5313 | No | ||
| 5 | PGK2 | 2650091 | 10781 | -0.004 | -0.5621 | No | ||
| 6 | BPGM | 5080520 | 11595 | -0.007 | -0.6049 | No | ||
| 7 | MDH2 | 1850601 | 12591 | -0.011 | -0.6570 | No | ||
| 8 | MDH1 | 6660358 6760731 | 12846 | -0.012 | -0.6691 | No | ||
| 9 | FBP2 | 1580193 | 13817 | -0.020 | -0.7186 | No | ||
| 10 | ENO2 | 2320068 | 14205 | -0.025 | -0.7361 | No | ||
| 11 | ENO1 | 5340128 | 14984 | -0.040 | -0.7728 | No | ||
| 12 | PGAM2 | 3610605 | 15878 | -0.073 | -0.8112 | No | ||
| 13 | PGAM1 | 2570133 | 17077 | -0.165 | -0.8540 | Yes | ||
| 14 | ALDOA | 6290672 | 18195 | -0.486 | -0.8505 | Yes | ||
| 15 | FBP1 | 1470762 | 18434 | -0.818 | -0.7563 | Yes | ||
| 16 | ENO3 | 5270136 | 18453 | -0.871 | -0.6432 | Yes | ||
| 17 | PGK1 | 1570494 630300 | 18612 | -4.983 | 0.0002 | Yes |

