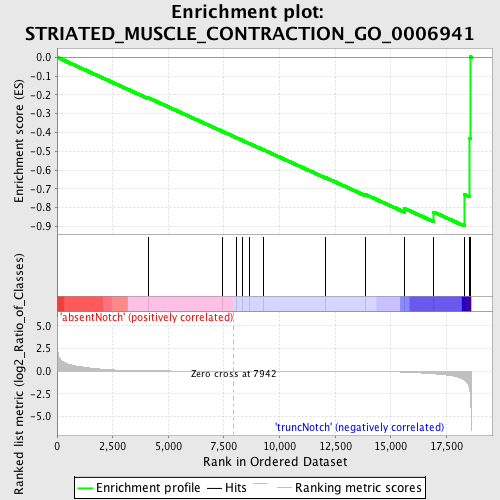
Profile of the Running ES Score & Positions of GeneSet Members on the Rank Ordered List
| Dataset | Set_03_absentNotch_versus_truncNotch.phenotype_absentNotch_versus_truncNotch.cls #absentNotch_versus_truncNotch.phenotype_absentNotch_versus_truncNotch.cls #absentNotch_versus_truncNotch_repos |
| Phenotype | phenotype_absentNotch_versus_truncNotch.cls#absentNotch_versus_truncNotch_repos |
| Upregulated in class | truncNotch |
| GeneSet | STRIATED_MUSCLE_CONTRACTION_GO_0006941 |
| Enrichment Score (ES) | -0.897214 |
| Normalized Enrichment Score (NES) | -1.5263919 |
| Nominal p-value | 0.007575758 |
| FDR q-value | 0.76894754 |
| FWER p-Value | 0.998 |
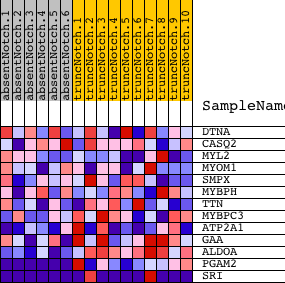
| PROBE | DESCRIPTION (from dataset) | GENE SYMBOL | GENE_TITLE | RANK IN GENE LIST | RANK METRIC SCORE | RUNNING ES | CORE ENRICHMENT | |
|---|---|---|---|---|---|---|---|---|
| 1 | DTNA | 1340600 1780731 2340278 2850132 | 4087 | 0.026 | -0.2151 | No | ||
| 2 | CASQ2 | 3170136 | 7433 | 0.001 | -0.3947 | No | ||
| 3 | MYL2 | 70471 | 8047 | -0.000 | -0.4276 | No | ||
| 4 | MYOM1 | 580091 | 8335 | -0.001 | -0.4429 | No | ||
| 5 | SMPX | 6590440 | 8655 | -0.002 | -0.4597 | No | ||
| 6 | MYBPH | 2190711 | 9262 | -0.003 | -0.4917 | No | ||
| 7 | TTN | 2320161 4670056 6550026 | 12084 | -0.015 | -0.6408 | No | ||
| 8 | MYBPC3 | 650390 | 13878 | -0.037 | -0.7308 | No | ||
| 9 | ATP2A1 | 110309 | 15626 | -0.115 | -0.8047 | No | ||
| 10 | GAA | 520035 | 16924 | -0.294 | -0.8231 | Yes | ||
| 11 | ALDOA | 6290672 | 18304 | -0.964 | -0.7291 | Yes | ||
| 12 | PGAM2 | 3610605 | 18524 | -1.782 | -0.4300 | Yes | ||
| 13 | SRI | 3390446 4850064 | 18576 | -2.493 | 0.0022 | Yes |